Target-Date Fund Research Series, Part III: Assessing Allocation Changes in TDF Glide Paths, Strategic or Tactical?
Morningstar’s 2017 Target Date Landscape Report indicates that approximately one quarter of TDF series shifted the target equity allocation of at least one vintage by 15% or more over the last 5 years and nearly half by at least 5%.
When an investor is considering a target date fund, the sales pitch is that they can “set it and forget it”, that their asset allocation will proceed merrily along a painstakingly selected glide path until it reaches the desired retirement (or post-retirement) date. Fund managers however, cannot maintain the same capital market assumptions and associated allocations indefinitely, and, as a result, do periodically shift their series’ glide paths, both strategically and increasingly, tactically. Morningstar’s 2017 Target Date Landscape Report indicates that approximately one quarter of TDF series shifted the target equity allocation of at least one vintage by 15% or more over the last 5 years and nearly half by at least 5%.
Changes to a series’ glide path are neither a clear positive nor negative. On the one hand, change can be beneficial in terms of correcting perceived errors, or adjusting to new information, reacting to significant recent events (like the Great Recession), updated forecasts etc. On the other hand, changes can be too frequent, excessive or reactionary rather than reflecting a well-considered plan – after all, excessive market timing can undo the perceived benefits of a strategic asset allocation policy for long-term, retirement investors. We would leave it to the analyst, advisor, consultant or investment officer to determine whether specific changes to any particular series’ glide path are a good or a bad thing. We do, however, believe that capturing the extent and frequency of historical changes to a glide path is relevant information.
BlackRock LifePath Index 1 Funds, one of the TDF families reporting a significant shift, increased their equity allocations in late 2014, producing a shift in glide path as seen below2.
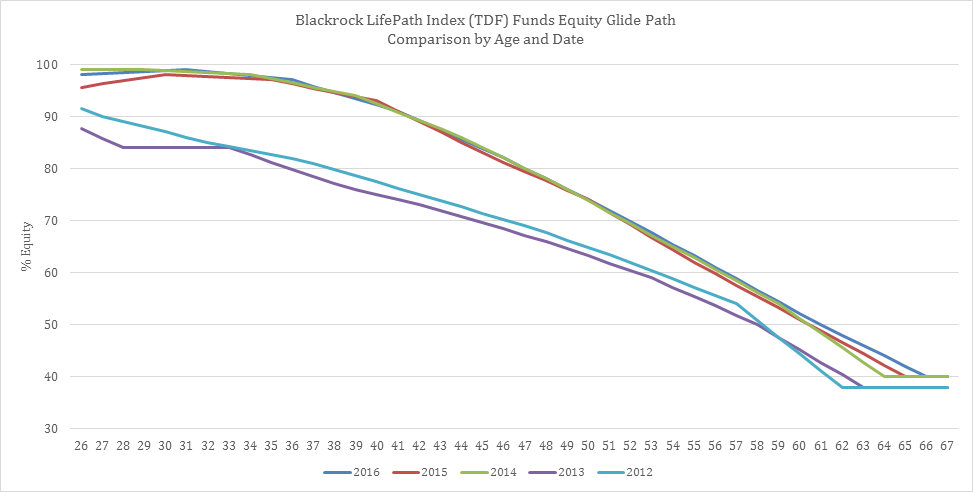 Source: BlackRock LifePath Index Funds’ annual reports, as of December 31st in the given year.
Whereas a plan or an advisor would only be aware of such a significant shift upon it being reported by the fund sponsor, often with a considerable lag, monitoring TDFs with quantitative analysis allows for more rapid detection of tactical asset allocation movements and glide path equity exposure. As we previously discussed in Part I and Part II, returns-based style analysis, in particular MPI’s DSA model, generally does an excellent job of estimating the cur equity exposures of Target Date Funds. Equity exposure estimates using DSA over the same time period quickly indicate change in glide path for all vintages, the middle dates to a greater extent than the near-term or the longest term.
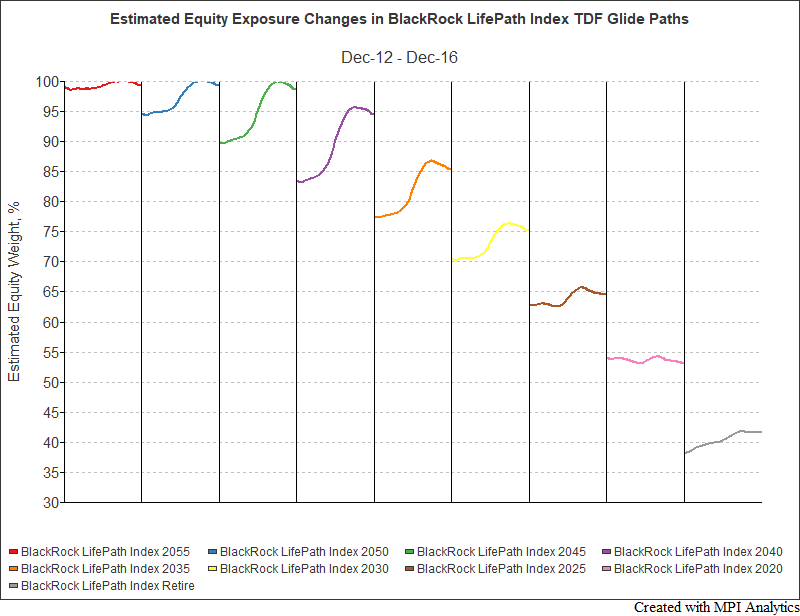 Source: MPI Analytics using Morningstar performance data.
A number of fund families, including BlackRock (with the launch of their LifePath Dynamic TDF series), are explicitly introducing a tactical allocation component to their TDF investment process, allowing managers to take advantage of perceived short-term pricing trends. Quantitative analysis can be an important tool for an analyst, advisor, consultant and/or sponsor to determine if such changes are warranted, or too frequent and reactionary. The historical exposures derived from RBSA are particularly useful for performance attribution, helping to correctly identify the managers’ contributions in terms of long-term asset allocation, and where applicable, dynamic allocation (market timing) and security selection.
Footnotes
- 1BlackRock LifePath Index Funds are one of three TDF series offered by BlackRock. Another series, BlackRock Dynamic Funds, are designed to “respond to opportunities in changing markets through active asset allocation and a blend of active, index and smart beta strategies”.
- 2% Equity is equal to the funds’ allocation to underlying equity index funds as stated in each year’s annual report and represents the holdings as of Dec 31st in the year given.