

To say that the post-Financial Crisis, Fed-fueled investing climate is one of markedly high correlations has become platitudinous. Managers of U.S. equity mutual funds know this all too well; the ability of the S&P 500 to explain their returns has risen to very high historical levels, with the average large blend fund exhibiting an R2 of over 99% recently.
But this doesn’t mean the bulk of mutual fund managers are investing their portfolios like the S&P 500. As correlations of individual assets increase, giving the initial impression that more and more active funds are closet index funds, a relatively recent statistic, “Active Share”, lends a deeper understanding of the degree to which a manager is actively managing a fund portfolio. Active Share measures the degree to which a fund differs from its benchmark as a percentage of total assets. The higher the Active Share, the more different it is, i.e. the manager has a more active management style. The lower the share, the more similar it is to its benchmark, i.e. the manager has a more passive investing style. A fund with an active share of 100 would have absolutely no assets in common with its benchmark, while a fund with an active share of 0 would be a perfect index fund.
Typically, Active Share is calculated based on gathering reported holdings. This is helpful, but as with most holdings information the data is often stale, too infrequent to be meaningful and incomplete.
Seeing a better avenue, we devised a way to gain greater transparency by looking quantitatively at funds using returns1. This allows us to understand the market factors behind a fund’s returns against those driving the S&P 5002. Additionally, this method has the added benefit of being current; practitioners can simply plug in daily or weekly fund NAVs.
We’re calling it Active Style®. And what we are finding is rather remarkable, highlighting the need to move beyond just looking at correlations when making investment decisions, constructing portfolios and communicating through investment reporting.
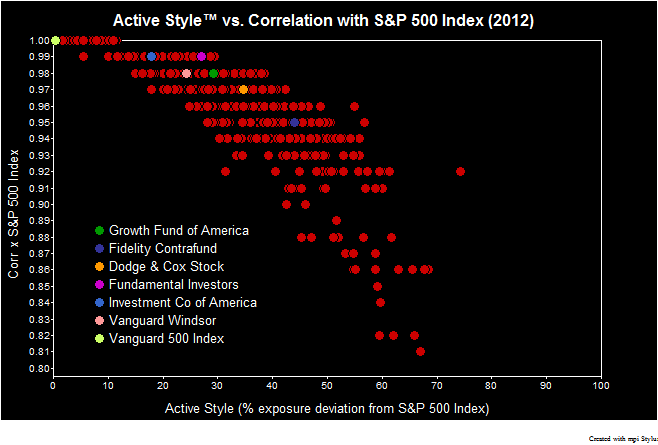
In the above chart, we show Active Style and Correlation YTD 2012 for all 866 large cap funds3 (of which 786 are active; note the yellow dot, the Vanguard 500 Index Fund (VFINX) which acts as an anchor with Correlation of 1 and Active Style® of 0).
Even actively managed funds that have a 99% correlation to the S&P 500 (such as AIVSX and ANCFX) can have Active Style ranging from ~12%-30%. Funds with 95% correlation (like FCNTX), often a level at which funds are labeled closet indexers, show Active Style of up to 60%; that means these funds, despite having 95% of their returns in line with the benchmark, can maintain a very active investment style with exposures significantly unlike that of the benchmark.
To demonstrate how relationships between the level of active management and performance can vary over time, we did some further analysis.
As seen in the below, over the course of 2012 the more a fund’s investment style differs from the benchmark (the higher the Active Style), the more they are likely to underperform. As one might expect, the dispersion in over/under performance also increases with Active Style.

When looking over other periods, however, we don’t see the same strong relationship with the market’s directionality. As seen in the below charts, we witness a similar tendency in 2011 (a rather flat year for the market with a 2% return) and the opposite tendency in 2010 (when the S&P 500 rose 15%). And what about a significant negative year? The bottom chart shows 2008, a year in which the S&P 500 fell 37%. Over that year we see there was a slight performance bias towards conformity with the benchmark/a passive style.


Overall, we do note that deviating from the style of benchmark led to underperformance on average during the examined years. And while it may be accepted knowledge that active management is, on average, a zero sum game (or negative after fees), it’s interesting, and an avenue for further research, to see how the active performance of specific groups can lean in one direction or another over certain periods. Active Style also helps illustrate the range of opportunities for funds with similar degrees of deviation from the benchmark.
It is time to look beyond measures of linear relationships, such as correlation, when designing portfolios, monitoring lineups and reporting on performance. This can help investors better comprehend their investments, particularly in these highly correlated, volatile markets of the New Normal.
Footnotes
- 1Utilizing our patent-pending technology to compare factor similarities and/or differences between investment products or portfolios based on returns, not holdings.
- 2For this analysis, we use S&P Sector return data and daily fund data from Morningstar.
- 3As categorized by Morningstar with AUM>$100M.