Archegos and Allianz Verdicts Are In: How to Avoid a Future Disaster
An analysis of the third mystery fund linked to both Archegos and the Allianz Structured Alpha funds’ meltdowns hints at the need for efficient and scalable top-down counterparty risk surveillance and monitoring for banks and investors.
Last week, former Allianz fund manager Gregoire Tournant was spared a prison term in a fraud case that led to the 2020 collapse of the Structured Alpha funds and caused $7B in losses to fund investors. In 2022, Allianz admitted fraud in misrepresentation of the strategy, paid over $6bn in fines and restitutions, was banned from doing business in the U.S. for a decade and was forced to sell its U.S. funds business. Back in 2021, we analyzed the Structured Alpha fund in MPI Stylus and pointed to the misleading nature of its claims, which later were identified as fraudulent.
Last month, however, Archegos’ Bill Hwang was sentenced to 18 years in prison for his role in the hedge fund meltdown which led to $10bn in losses to the fund’s counterparties, and ultimately contributed to the collapse of Credit Suisse due to the episode’s $5.5bn hit on the bank.
Despite the difference in strategies (and the sentences!), the substance of the cases is quite similar: both managers misled either their investors (Allianz) or counterparties (Archegos).
There exists another subtle link between both cases that provides a good lesson in risk management for all parties involved, regulators included.
According to Bloomberg News, “a year before the [Archegos] blowup, the bank’s leadership missed an opportunity to plug the holes in its risk-management operation, leaving the bank vulnerable to a repeat.” During the pandemic drawdown, Credit Suisse failed to spot a hedge fund client of the bank’s equity derivatives desk, Malachite Capital, that was engaged in a risky volatility strategy—one that was similar to Allianz’ Structured Alpha funds, which also immolated during the same period.
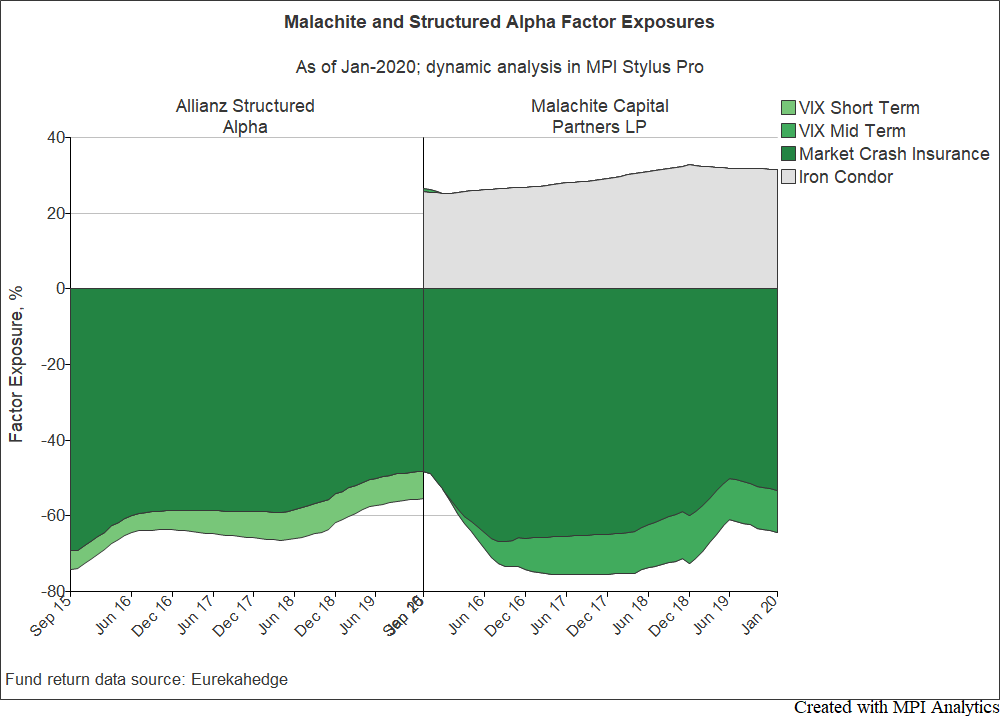
An MPI Stylus analysis of the funds’ reported monthly NAVs shows Malachite, like Structured Alpha, appeared to be doing the exact opposite of their expressed objective (providing “U.S. equity-like returns with lower volatility” and less risk of loss than the S&P 500).
From a factor perspective, both strategies look remarkably similar. Instead of protecting investors in the event of a spike in volatility and a market collapse, Malachite and Structured Alpha engaged in a strategy exposed to many multiples of market risk. The funds behaved as if they were, in fact, “selling market crash insurance”[1] and exposed their clients to volatility. And as with Structured Alpha, Malachite clients were attracted to the strategy by a steady stream of uncorrelated returns.
It turns out that appeared to be nothing more than option premiums from such “insurance”.
Assess a fund’s potential exposure to complex hypothetical market shocks or historical regimes in MPI Stylus Pro.

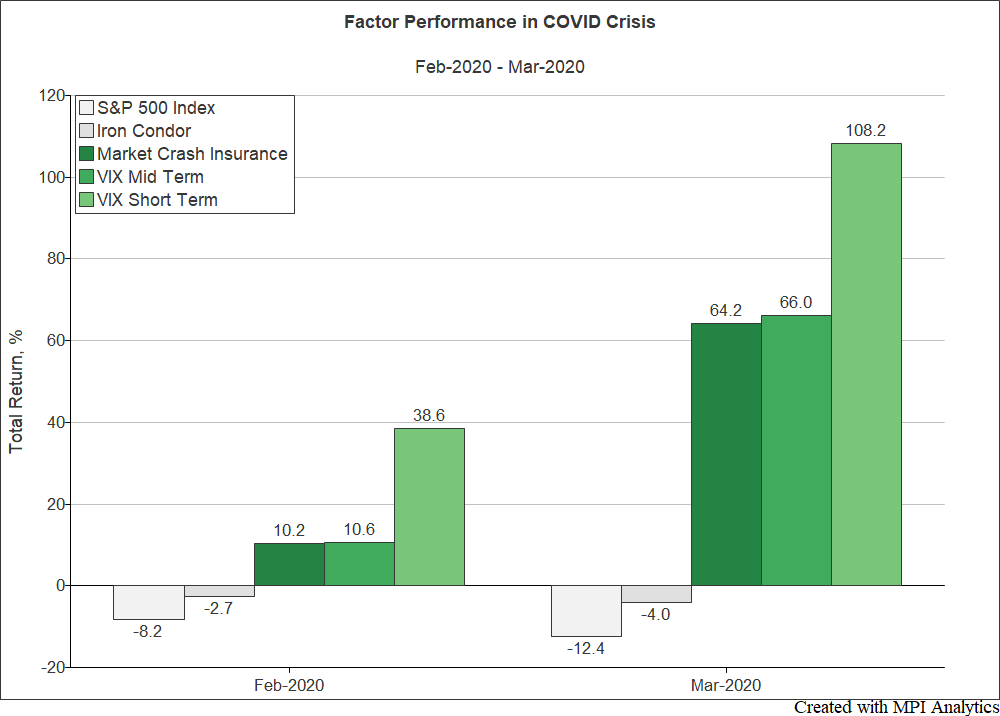
With a swift and severe drawdown starting Feb 19th 2020—resulting in realized and implied volatility both spiking and sending the market crash insurance (tail) factor up about 80% during this period—it is no surprise that both funds blew up, damaging fund investors and counterparties alike.
Credit Suisse lost $214 million in the Malachite collapse and $5.5bn in the subsequent Archegos blowup. The bank’s internal special Board of Directors report on Archegos Capital Management determined that the failure to learn from the Malachite debacle ultimately led to the Archegos disaster, which eventually contributed to the bank’s collapse two years later:
“While the Malachite incident was distinct from Archegos in many ways, certain of the issues and deficiencies ultimately identified there appear to have recurred with Archegos, including: Insufficient monitoring of client trading strategy and holistic assessment of counterparty risk…”
In a government-engineered rescue backed by Swiss taxpayers, Credit Suisse was acquired by UBS.
It is fascinating how all the underlying complexity of volatility trading strategies—regardless of how many exotic derivatives positions are involved—can be distilled succinctly and economically, using just monthly NAVs or a P&L, into a picture (or a chart) that provokes nightmares for a risk manager.
To learn how savvy risk managers, top fund gate keepers, leading consultants and even regulators can use top-down returns-based monitoring and surveillance tools to help spot red flags and potentially prevent such blowups from damaging their clients and businesses, check out our approach.
MPI’s powerful visual platform enables users to analyze fund peer groups and universes across an unlimited library of pre-set and custom analytics.

_________________________________
[1] We subtracted S&P 500 Index returns from the CBOE VIX Tail Hedge index (VXTH) to extract the tail hedge portion of the index, consisting of out-of-the money VIX options and called it the “Market Crash Insurance” factor. See our 2021 research on Structured Alpha for more background and details. In the dynamic factor exposure chart green color denotes volatility factor loadings with the “Market Crash Insurance” factor capturing the tail risk. Iron Condor factor is a relatively conservative strategy and is not exposed to VIX tail risks.
Disclaimer:
Some statistics on this page are based on exposure estimates obtained through quantitative analysis and, beyond any public information, MPI does not claim to know or insinuate what the actual strategy, positions or holdings of the funds are, nor are we commenting on the quality or merits of the strategies. Deviations between our analysis and the actual holdings and/or management decisions made by funds are expected and inherent in any quantitative analysis. MPI makes no warranties or guarantees as to the accuracy of this statistical analysis, nor does it take any responsibility for investment or any other decisions made by any parties based on this analysis.


