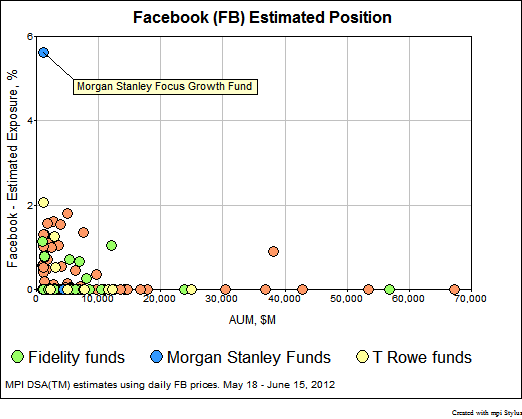
Chart of the Week: Facebook
While Facebook’s IPO was a landmark event for so many reasons, we thought it would be interesting to see what quantitative analysis of a galaxy of mutual funds using daily data can show a savvy fund investor. With any large, much-heralded new offering, buyers of the security must emerge. In the case of Facebook, buyers […]
While Facebook’s IPO was a landmark event for so many reasons, we thought it would be interesting to see what quantitative analysis of a galaxy of mutual funds using daily data can show a savvy fund investor.
Sign in or register to get full access to all MPI research, comment on posts and read other community member commentary.


