Elite U.S. Endowments: Government Funding and Liquidity Pressure
Federal funding cuts could impose significant financial strain on elite universities. One key factor in determining a university’s resilience to such funding disruptions is the liquidity of its endowment.
4/23/2025 Update: All statistics in this research, including unfunded private equity (PE) liabilities, have been updated with fiscal year 2024 (FY24) data. Key takeaways include:
- Yale and Harvard hold the highest unfunded PE commitments, at $8.1 billion and $8.2 billion respectively. Notably, any shortfall from annual government funding represents a small fraction of these obligations.
- Liquidity risk rankings show Yale moving into the #2 position (62.1%) behind Brown (88.4%), followed by Harvard (53.2%) and Princeton (51.2%).
- According to our analysis of FY24 financial statements, Harvard has the largest absolute allocation to PE—$24 billion, representing 39% of its total investment portfolio (including the endowment). Yale leads in relative terms, with 47% of its investments ($21 billion) allocated to PE
- With FY24 average PE distributions at the lowest level in over a decade it is not clear how these massive endowments are able to fund capital calls, not to mention any potential gaps in funding.
- Cornell and Columbia demonstrate comparatively low liquidity risk among elite institutions, at 16% and 28% respectively. However, a federal funding freeze could exacerbate their financial strain—though not to the same extent as Brown, Yale, Harvard, or Princeton.
- Dartmouth possesses the most resilient endowment portfolio against potential pressures, with MIT following closely behind.
Princeton University recently became the latest elite institution to face financial pressure as the Trump administration intensified efforts to enforce policies on antisemitism. As part of this effort, the U.S. government froze several dozen of research grants to Princeton, following similar actions against Columbia and Harvard Universities. Additionally, it suspended $175 million in funding to University of Pennsylvania due to UPenn’s refusal to comply with the administration’s ban on men participating in women’s sports.
Federal funding cuts could impose significant financial strain on universities, though some institutions rely more heavily on government support than others. One key factor in determining a university’s resilience to such funding disruptions is the liquidity of its endowment. Over the years, Ivy League endowments have increasingly allocated their assets to illiquid private equity investments. According to MPI Transparency Lab, private equity holdings now represent approximately 37% of assets under management (AUM) and an even higher percentage of overall exposure to the asset class when measured quantitatively.
Compounding this issue, elite institutions are already experiencing substantial liquidity pressures as they scramble to raise cash for private equity capital calls. A year ago, Princeton’s PINCO CIO Andrew Golden told Financial Times this has been the “‘worst ever environment for liquidity” in private equity. The introduction of government funding cuts or freezes only exacerbates this situation because 60-70% of the government grants are typically used to cover overhead on-campus costs.
To better understand which endowments are most sensitive to federal funding disruptions, we expanded our 2023 fiscal year liquidity research. The relationship between funding vulnerability and endowment size is not straightforward—many factors play a role beyond just the overall size of an institution’s endowment.
Liquidity Risk vs. Government Funding Dependence
For our analysis, we extracted U.S. federal grant numbers from endowment FY24 annual reports and USA Spending website (for Dartmouth and UPenn). We have not included federal grants related to SLAC for Stanford and Lincoln Lab for MIT, as both labs are government-owned.
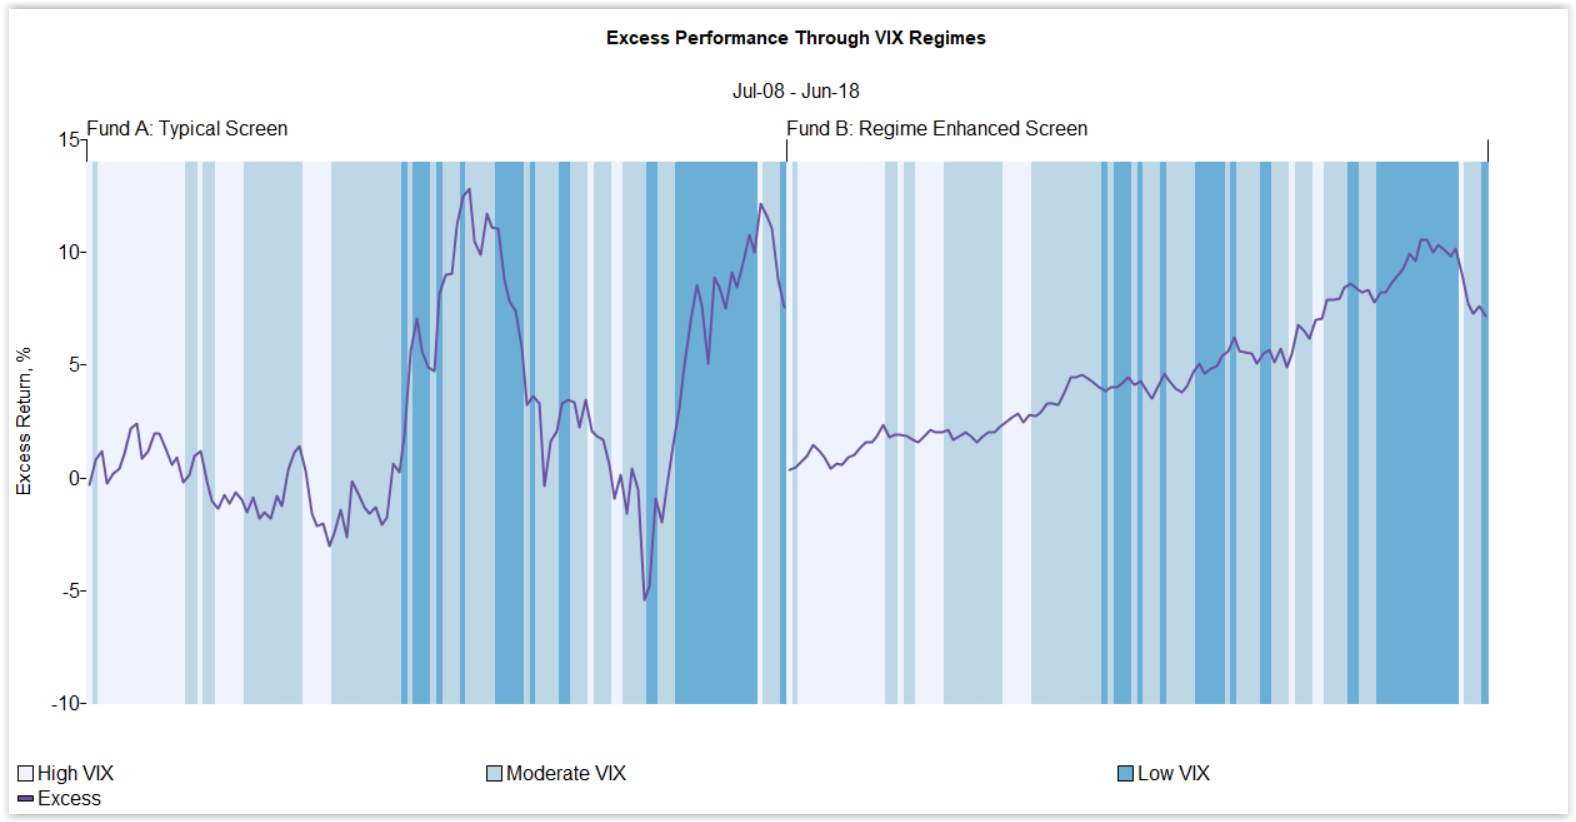
Assess a fund’s potential exposure to complex hypothetical market shocks or historical regimes.
Furthermore, liquidity risk varies across institutions. The diagram, “Elite Endowment Liquidity and Govt Funding Risk”, illustrates endowments’ estimated funding risk (X-axis), calculated as the ratio of FY24 U.S. grants to the liquid portion[1] of the endowment portfolio, against liquidity risk (Y-axis), defined as the ratio of unfunded private equity commitments also to the liquid portion of the endowment portfolio.[2]
Some takeaways:
- Columbia, and Cornell are clear outliers and among the most vulnerable to federal funding freezes. Despite having the lowest allocation to private equity among elite endowments, the heaviest among Ivies reliance on government grants brings them to the average Ivy levels in the overall liquidity stress.
- UPenn is under elevated pressure with PE liquidity and funding freeze risks being about average in both categories.
- Brown is highly vulnerable due to its already high PE liquidity constraints and elevated funding risk of 13.6% (above the Ivy average 11.2%). According to MPI Transparency Lab’s liquidity analysis, Brown has the highest ratio of unfunded PE commitments to PE allocation Brown has the highest ratio of unfunded PE commitments to PE allocation (34%) among ten elite universities. This may suggest that Brown’s PE portfolio has the youngest average vintage, which could, in turn, indicate a lower level of expected near-term distributions.
- Brown (88.4% liquidity risk), Yale (62.1%), Harvard (53.2%) and Princeton (51.2%) are highly vulnerable to funding cuts because of already significant liquidity risk.
Spending Rates and Funding Risks
Most endowments have their spending allocations in the 4.5-5.5% range. The 10 elite schools tracked by MPI Transparency Lab have their spending range from 4.6% (Cornell) to 5.5% (Columbia) with an average of 5.0%. FY24 NACUBO endowment study estimated an average spending rate of approximately 4.8% for all endowments.
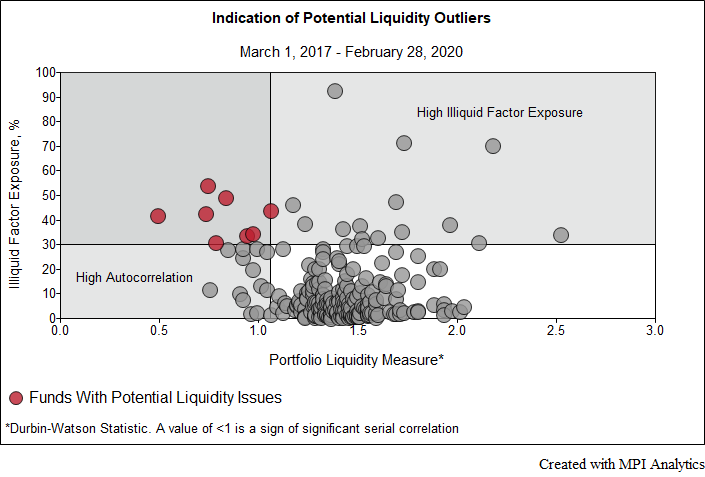
Offering a practical framework for investment practitioners to screen and monitor liquidity risks in fixed-income products
Some takeaways:
- Columbia and Cornell are most dependent on federal grants with such grants exceeding endowment spending by more than 50%.
- UPenn and Brown are in a close second cohort with federal grants being slightly lower than the spending rate.
- Harvard and Princeton have the lowest relative dependency and, if liquidity wasn’t the issue, they could have covered some or all the expenses. But liquidity is the issue at Harvard which just last month announced yet another bond sale of $450 million bringing its total debt to at least $7.6 billion. And Princeton has announced this week that it’s selling $320 million of taxable bonds.
Unintended Legacy of David Swensen
As we wrote on these pages, for many years the endowment model worked very well, allowing Yale and other Ivy League schools to earn consistently high returns that outperformed most public benchmarks, leading the industry to focus more on their abnormally high returns and less on the hidden risks that some of illiquid investments in Ivy endowment portfolios carried.
However, beyond market risks and recent performance declines, one crucial legacy of David Swensen’s model is its inherent vulnerability to external pressures—particularly from government actions. Ironically, the very approach that revolutionized endowment management also left these institutions exposed to liquidity constraints in times of financial or political stress—an unintended consequence that even Swensen himself may not have fully anticipated.
Of course, several other factors must be considered, including the probability of specific grant cuts, variations in institutional spending patterns, and the long-term flexibility of these endowments. However, this back-of-the-envelope analysis provides a useful starting point for stakeholders assessing financial risk in the current climate.
________________________________
[1] For liquid assets we use the sum of Cash/Short-term, Bonds and Equity allocations. Not all of it could be available on daily, monthly or quarterly notice. The actual liquid assets could be significantly less than the stated number.
[2] Private equity (PE) capital calls are typically spread over several years. To make the X and Y axes comparable when estimating the impact in a single year, it may be necessary to divide the Y-axis value by three. Additionally, potential credits from PE portfolio distributions should be considered. Figures for unfunded commitments and liquid allocations have been updated using FY24 annual reports.
Technology Solutions
Trusted by


