Markov Processes International

2022 Endowment Saga: How the Mighty Have Fallen

On Wall Street, as the old saying goes, you’re only as good as your last trade.

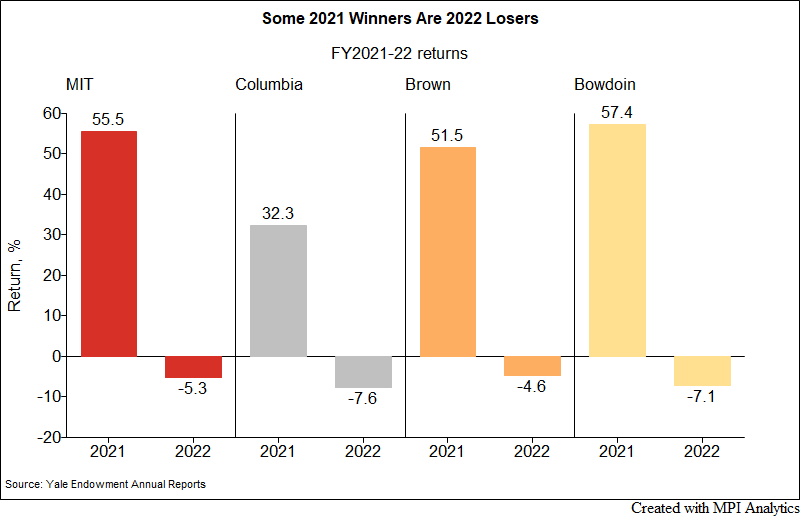
This was a difficult fiscal year for endowments across the board, but performance looks especially worse for the ones that were the standouts from last year, yet yielded poor results compared to their peers in FY2022. Specifically, $24.6B MIT endowment’s return of -5.3%, $13.3b Columbia’s -7.6%, $6.5B Brown University’s -4.6%, and $2.5B Bowdoin’s -7.1%, put them in the bottom of either the Ivy group or large endowments.

Oh, how the mighty have fallen. But how did they fall? That’s where it gets interesting.

First, it’s important to remember that these are not endowments used to report losses. Indeed, MIT’s -5.3% return marked the first loss since the global financial crisis, when all endowments took a major hit. On a real dollar basis, this year’s losses seemed severe. MIT’s endowment shrunk by $2.8B as compared to FY2021, Columbia lost $1B, and Brown’s endowment lost $500 million in value.

This was a tough year given how well all four had performed. Remember that Brown’s endowment was the best performing “Ivy” three years in a row through 2021 and became top-performing Ivy on a 10-year basis. Through our quantitative analysis we attributed Brown’s great prior performance to their concentration (whether intentional or not) in the Technology sector. Bowdoin, too, produced outstanding returns consistently, actually topping all of the Ivys over the past 10 years – gains we attributed to their tilt of privates toward high-performing VCs.

As we noted Columbia was a mediocre performer compared to its high-flying Ivy peers because of their lesser focus on privates and more on absolute return and traditional equity strategies. Yet, it still managed to report good gains last year.

So what drove their performance to slide this year? The answer comes straight from Tolstoy’s Anna Karenina: “Happy families are all alike; every unhappy family is unhappy in its own way.”  As we alluded in our earlier reviews of UPenn and Yale, the “happy family” performance for all endowments comes from the same place: Endowments were able to weather strong market losses by investing in private equity, venture capital, real assets, and other illiquid private investments.

The chart below shows MPI-estimated asset class contributions to FY2022 returns. Positive contributions are coming from PE and are about the same ~2%. The exception was Bowdoin with only ~1% upside, because, as estimated by our model, their private asset portfolio’s exposure is dominated by venture capital investments (e.g., Sequoia) which significantly underperformed buyouts in FY2022.[1]

The “unhappy family” downside performance is far more endowment-specific. They all saw their losses come from their own way.

Brown’s Technology focus is biting them this year and is the biggest driving factor to their underperformance. Columbia, on the other hand, saw their largest estimated loss coming from emerging-market equity exposure. MIT’s “unhappiness” is coming from a mix of the foreign equity and tech.

Then there’s Bowdoin, which suffered from a significant exposure to U.S. public equities. We also mentioned that their VC exposure provided lesser cushion than their peers received from their buyout-dominated private investments. Add to this Bowdoin’s poor manager selection and the results become the second-worst in the group. The selection element is related to the unexplained portion of returns — it’s the proverbial alpha which is typically close to zero for any given large endowment. Bowdoin isn’t a large endowment, however. At $2.5B, Bowdoin is the smallest in the group, so manager selection shows up. You would want for it to be positive, but this year is different and it’s possible that overconcentration in Sequoia or a similar fund lowered their performance as compared with the generic diversified VC index.

Back in August we projected that large endowments over $1B in assets would lose on average 5.4% in FY2022, outperforming domestic 60-40 portfolio by almost 5%. From this perspective, the group performed as an average endowment in the category or slightly below, still outperforming the 60-40 portfolio and most smaller endowments. But let’s not forget that a significant portion of the outsized 50%+ returns they achieved in FY2021 were driven primarily by private investments and, therefore, are still on paper and yet to be marked to market. We will be closely watching private asset benchmarks over the next two quarters to have a better grasp on the real performance of the group.

Please read our earlier research for more information about our Methodology.

DISCLAIMER:

MPI conducts performance-based analyses and, beyond any public information, does not claim to know or insinuate what the actual strategy, positions or holdings of the funds discussed are, nor are we commenting on the quality or merits of the strategies. This analysis is purely returns-based and does not reflect actual holdings. Deviations between our analysis and the actual holdings and/or management decisions made by funds are expected and inherent in any quantitative analysis. MPI makes no warranties or guarantees as to the accuracy of this statistical analysis, nor does it take any responsibility for investment decisions made by any parties based on this analysis.

[1] Bowdoin provides a single number for the private equity allocation in its financial reports which includes “buyout, venture capital and distressed credit strategies.”

Exit mobile version