FY2023 Ivy Report Card: Volatility Laundering and the Hangover from Private Markets Investing
Ivy and elite endowments did poorly in fiscal year 2023, especially relative to a global 70/30 benchmark and smaller, less resourced endowments that invest in less private markets assets/funds than those employing the ‘Yale model’.
FY2023 Report Takeaways:
-
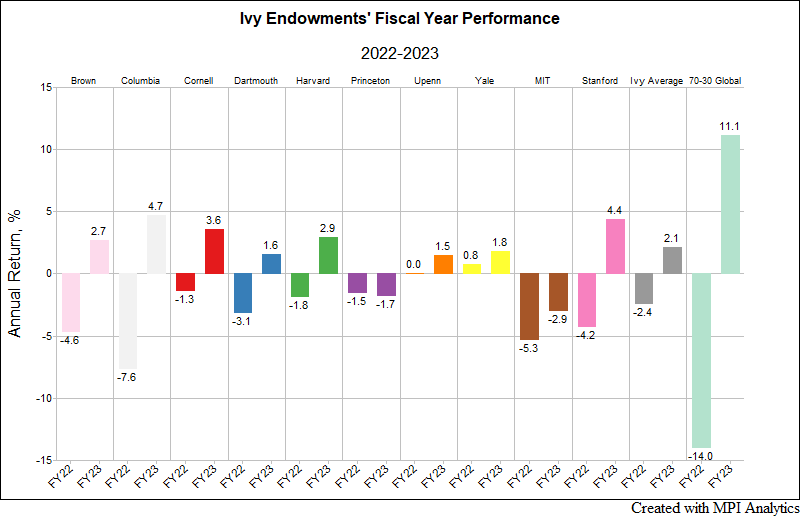
- Ivy and elite endowments did poorly in fiscal year 2023 (+2.1%), especially relative to a global 70/30 benchmark (+11.1%) and smaller, less resourced endowments (+9%) that invest in less private markets assets/funds than those employing the ‘Yale model’.
- Private Markets Dichotomy: FY2023 was the first year when private equity (PE) and venture capital (VC) noticeably moved in opposite directions (PE +6.1%; VC -10.2%) since FY 2003 when VC valuations continued to fall after the bursting of the Dot com bubble.
- Short-term drivers of Ivy and elite endowments: Allocations to VC on the downside and PE and public equity on the upside contributed significantly to elite endowment performance dispersion in FY2023.
- Longer-term drivers of performance = more risk. Over 10-yrs, Ivy and elite endowments show a very clear relationship between returns and risk-taking; simply put, these endowments appear to be levered versions of a global 70/30 portfolio. All schools exceed the 10-yr return of a global 70/30 (+6.8%), with the average Ivy returning 9.8%, but with significantly more risk. With a 12.6% standard deviation based on annual reported returns and an estimated 15.1% volatility based on Transparency Lab models, the average Ivy is projected to be almost 50% more volatile than the global 70/30 (10.71% volatility). The top performers over 10 years, MIT (+11.5% return, 21% modeled volatility) and Brown (+11.3%, 19.8% estimated standard deviation), show nearly double the risk of the benchmark. Yale appears to have the most efficient portfolio (14.3% standard deviation with a +10.9% return).
- Laundered risk is still risk: Despite the masking or laundering of volatility related to investing in private markets assets, which Ivy endowment CIOs state as a benefit of the Yale model, elite endowments are significantly riskier than a balanced portfolio invested in 70% stocks.
The Scorecard
Ivy endowments’ Fiscal Year 2023 numbers are in, and they are disappointing. This is especially so when compared with smaller, often less complex endowments and a global 70/30 stock/bond benchmark. The average Ivy League endowment return for the year ending June 30th, 2023 was a 2.1% gain. That compares to the average Ivy endowment loss of -2.4% in FY2022. The best-performing endowment, $13.6 billion Columbia University, gained 4.7%, while the worst-performing endowment, $34.1 billion Princeton, lost -1.7%, the only Ivy showing a loss for the fiscal year. And when including the largest elite non-Ivy cousins MIT and Stanford, the $23.5 billion MIT endowment reported an even deeper loss for FY2023, amounting to -2.9%, following a -5.3% loss in FY2022.
Sign in or register to get full access to all MPI research, comment on posts and read other community member commentary.


