FY24: Princeton & Yale Returns Dragged by VC & Lack of Stock Exposure, Harvard boosted by Tech & Hedge Funds
Ivy endowment Fiscal 2024 in review: risks; VC; long-term vs recent years; prospects of Yale Model.
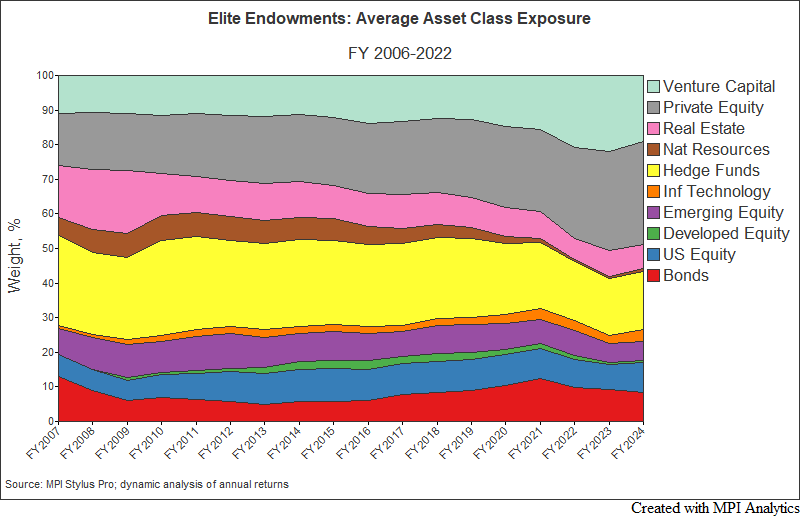
- Low exposure to domestic stocks and higher exposure to VC and growth private equity hurt Ivy endowments for the second year in a row.
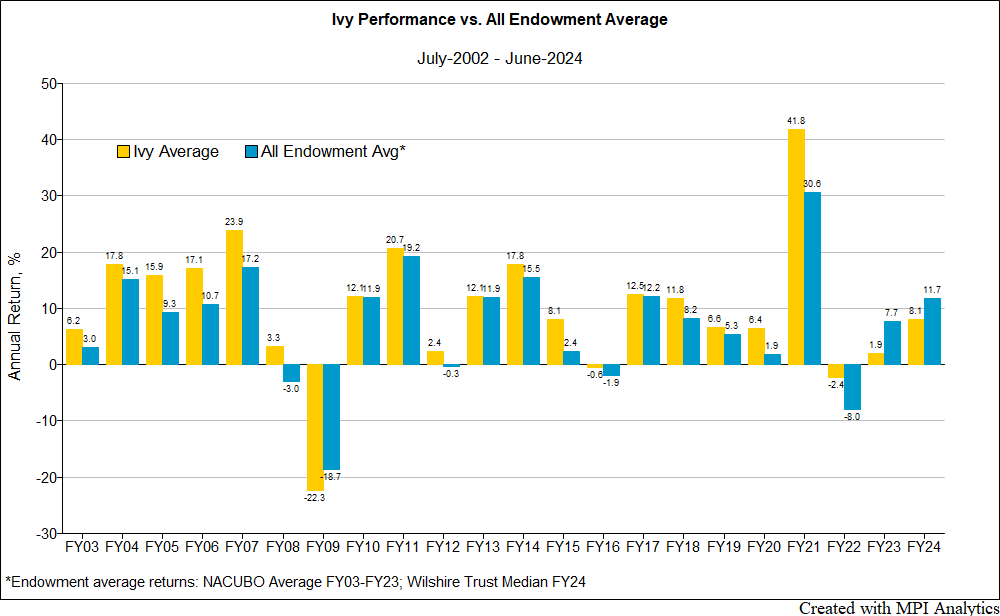
- For the first time in over two decades, the average Ivy underperformed the average endowment (and the global 70/30) for the second consecutive fiscal year.
- High beta VC and growth PE portfolios at some elite endowments likely detracted from performance. Is the nadir for private growth investments in the rearview?
- Harvard impressed with another good year but watch risk levels at largest endowment.
- Long-term performance still validates the Yale model’s preference for privates, but recent years show the merit of simple 70/30 stock/bond portfolios, especially when adjusting for risk. Still, we don’t see Ivies changing allocation habits, risk-taking.
- More normalized distributions climate from GPs and less liquidity pressure will be welcomed. Improved deal making environment could alter privates picture going forward (both returns and distributions), but elevated yields could prove a roadblock to activity, sought valuations, while dry powder and competition could impact returns.
Fiscal 2024 reporting season for the venerable elite and Ivy League endowments concluded recently. Perhaps unsurprisingly, the first half of the season was front-loaded with the top-performers. With an 11.5% return, Columbia (Kim Lew) led the class for the second consecutive year, while Brown (Jane Dietze) took salutatorian, trailing by a hair (11.3%).
The curtains were drawn on October 25th when Yale (CIO Matt Mendelsohn) reported a 5.7% return, just ahead of Princeton, whose 3.9% return published the day prior. Bringing up the rear in the Ivy league tables for the second year in a row, it was the $34.1bn endowment’s final year under legendary leader Andrew “Sparky” Golden, a “Yale Pup” who helmed the Tigers’ ship for nearly three decades since 1995 when it was under $4bn.
How did these top investors who adhere to the ‘Yale model’ do? Overall, the average Ivy again underperformed not only the Global 70/30 benchmark, but also the average endowment (equal weighted) for the second consecutive year. By our count, it was the first time that the average school (and the simple 70/30) has beat the Ivies two years running since fiscal 2003—when our records for all Ivies begin.[1]
Year Is but a Blink
Before we dive in focusing on the recent past, it’s worth sharing a haiku Golden penned in the Princeton FY 2023 report, published in January during fiscal ’24 ahead of turning over the keys to Vincent Tuohey (MIT) for fiscal 2025:
“Short terms involve ups and downs
Long term is mantra!”
As we wrote in October: For institutions managing assets for perpetuity, we recognize a fixation on annual performance isn’t entirely constructive, especially when compared to peer schools with their own set of unique circumstances and goals.
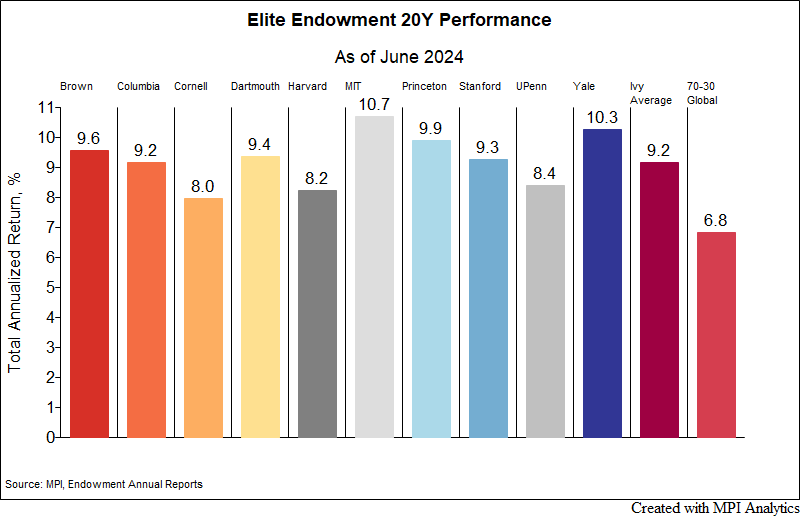
Indeed, Princeton’s 9.9% return over 20 years is just behind Yale (10.3%) and leader, Ivy+ endowment MIT (10.7%, Seth Alexander). The trouncing of a simple rebalanced portfolio of 70% global stocks and 30% US bonds (6.8%) by these endowments and the 9.2% Ivy average shows the power of incorporating alternatives and private markets, hallmarks of the ‘Yale model’, over the long-term for well-resourced institutions with infinite horizons.
But the elite endowments running the Yale model are rightfully revered for their sophistication, innovation and access to the top investors and opportunities across asset classes and strategies spanning global markets.
While we certainly don’t advocate other investors with different objectives, resources and more limited time horizons follow their lead (in part due to what appears to be a healthy and growing appetite for risk), utilizing returns-based analysis to decompose the likely sources of endowments’ returns from the top-down has become an annual tradition amongst the investment community. Seeking light beyond the extremely limited information disclosed on endowments’ holdings, allocation decisions and performance (one return point per year), we feel this exercise—focusing on a portfolio’s behavior[2] rather than reported asset allocation pie charts where categorization standards vary from school to school—can provide insights into the interplay of risk and return, the role of asset allocation and manager selection skill. Herein lies the power of quantitative techniques.
As such, these annual reviews can be filled with lessons for investors of various stripes—including smaller endowments, multi-asset strategy investment teams, advisors and consultants tasked with selecting TDFs or model portfolios, and investors considering how much active management and alternatives to add as a satellite to a cheap, passive, vanilla stocks + bonds core.
Keeping the longer-term in mind while reviewing the near-term, it is worth noting that this is our tenth fiscal year publishing analysis on the Ivy / elite endowments. You can find a full archive of prior research and analyses on endowments here and in the MPI Transparency Lab, our public repository of historical performance data, exposures and risk on pensions and endowments, including pdf reports on each institution. Thank you for reading and sharing in the journey. If you’d like a custom analysis, or for us to look into an aspect you haven’t seen us tackle, free to reach out!
October Surprise(s)
In the spirt of this election year, was there an ‘October surprise’ so to speak? While $14.8bn Columbia and $7.2bn Brown were anticipated to be at the top of the pack (and indeed ended up there, for different reasons, which we covered here), the largest Ivy endowments of $53.2bn Harvard, $34.1bn Princeton and $41.4bn Yale each provided an element of intrigue. Harvard, the nation’s largest endowment, outperformed our expectations[3] with its 9.6% return to finish in third, behind Brown. Conversely, at the bottom of the League tables, Princeton’s 3.9% and Yale’s 5.7% both came in under our expectations based on quantitative analysis, achieved using Stylus Pro with 20 years of returns through FY’23. Our estimates were based on FY2023 factor exposures and do not account for any potential portfolio adjustments nor asset class reallocations made during FY2024.
Assess a fund’s potential exposure to complex hypothetical market shocks or historical regimes in MPI Stylus Pro.
Public-Private Equity Dichotomy
Harvard’s outperformance and Princeton and Yale’s lackluster relative returns speak in part to the year’s biggest theme for elite endowments—the dichotomy between private markets, specifically growth private equity and/or venture capital, and public equities, specifically domestic stocks.
Sign in or register to get full access to all MPI research, comment on posts and read other community member commentary.
Technology Solutions
Trusted by


