How Brown and Columbia Landed at the Top of the FY2024 Class

With Mag 7 stocks trouncing VC and Private Markets trailing in FY2024, Columbia and Brown lead Ivy endowments but with vastly different risk and exposures

October 09, 2024

Fiscal year 2024 Ivy League and elite endowment reporting season is officially underway. Dartmouth kicked things off with an 8.4% return. Then Columbia posted their 11.5% figure, and Brown followed with an 11.3% return, reported Friday.

Based on our estimates of asset allocation modeled with MPI Stylus using reported annual performance[1], we estimate Columbia’s 11.5% return from July 2023 through June 2024 will be at the top of the class of elite endowments (Ivy League plus Stanford and MIT). There is a chance it is salutatorian though, as the competition for valedictorian looks solid[2]. We expect an average return for the elite endowments between 9% and 10.5% for fiscal 2024.

After another strong year for public equity, specifically the so-called Magnificent 7 powering U.S. stocks, and a muted year for private markets, including another negative year for venture capital—a staple in Ivy endowments—we don’t expect any elite school following the alternatives-heavy “Yale model” to beat the robust 14.20% return of a global 70/30 portfolio[3] for the second consecutive year. Simpler, more vanilla endowment portfolios allocated primarily to stocks and bonds found at smaller, less-resourced schools, could again prove hard to beat. Those that do will likely have overweighted domestic stocks, particularly technology.

The largest, storied endowments—Harvard, Yale, Princeton—could see returns lower than Dartmouth. As for Columbia sitting at the top, we look forward to seeing if there are any surprises who surpass their return.

Longer-Term View: For institutions managing assets for perpetuity, we recognize a fixation on annual performance isn’t entirely constructive, especially when compared to peer schools with their own set of unique circumstances and goals.

So far, with a 10.8% annualized 10-year return, Brown’s lock on the stop spot amongst the Ivy league over the recent decade window remains intact. We anticipate the $7.2bn system helmed by Jane Dietze, the smallest school in the group, to continue pulling away from Princeton and Yale in the recent decade window (through FY 2023, respectively, $34.1bn AUM with a 10.8% annualized 10-yr return and $40.7bn returning 10.9%). In the expanded “elite” grouping, MIT’s 11.5% was ahead of Brown (11.3% through FY 2023).

While Dartmouth’s FY 2024 return is anticipated to be closer to the bottom of the class, as mentioned we could see some of the largest systems with the highest exposure to private markets assets—especially venture capital—struggling to beat Dartmouth. Over 10-yrs, Dartmouth should continue to best the Ivy average with its 9.5% return through June 2024 (10.5% to 9.8% as of FY2023).

Asset Class Returns FY2024

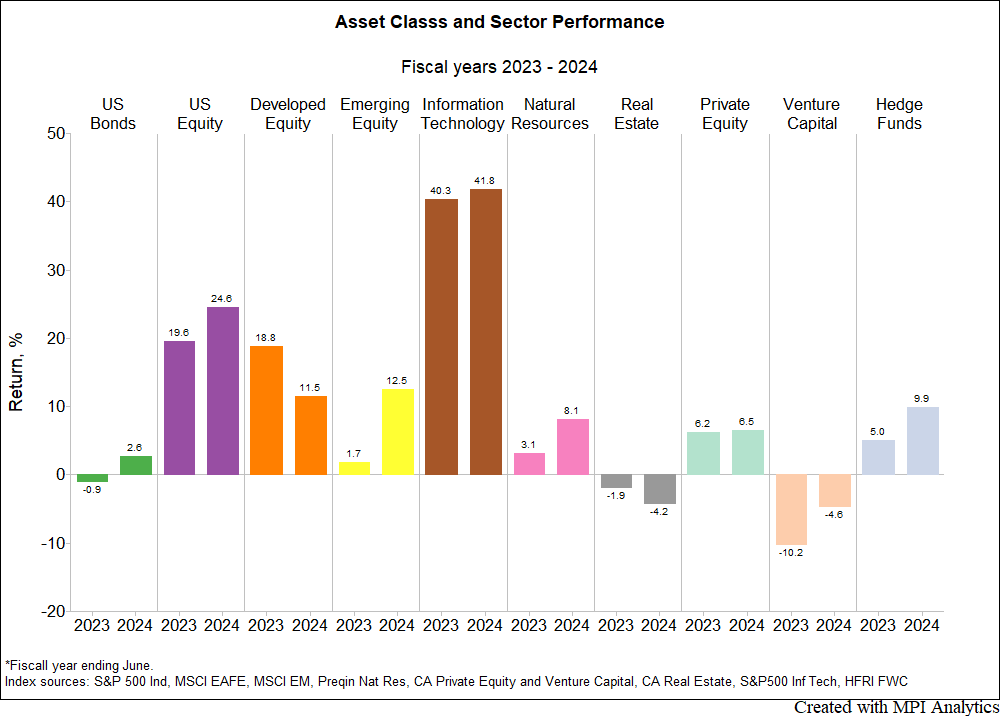
As we covered in our pensions return projections, FY 2024 was defined by the outperformance of U.S. stocks. Domestic public equities again led broad asset classes in FY2024, with mega-cap technology companies once more powering the S&P 500’s 24.6% return. The S&P 500’s Information Technology sector was up 41.8%, following an already remarkable turnaround in FY 2023. Endowments’ modelled exposure to stocks can come directly from equity allocations but also from placements with hedge funds that hold equities.

Asset Allocation & Portfolio Construction

Saves time and money with one comprehensive software platform that provides both historical and forward-looking analysis capabilities

Learn More
The biggest detractor from performance was Venture Capital, with a -4.6% loss, followed by Real Estate, down -4.2%. VC’s loss was an improvement on FY2023 (-10.2%), however, it was likely a continued drag on endowment portfolio performance after a stellar 2021. Dartmouth, for instance, saw a massive benefit from VC exposure in FY2021 when the endowment reported a 46.5% return, as did Brown when they returned 51.5%.

Private equity returned 6.5% in FY 2024, similar to its performance in previous years. Overall, directionally, FY2024’s asset class performance mirrors the previous year’s results.

Beyond the trend of public assets (stocks) beating private markets, another determining attribution theme we see is the breakdown of elite schools’ asset allocation within private markets between private equity and venture capital. As it was in FY2023, this divergence between PE and VC could be a defining feature of some schools’ results in FY2024. It likely benefited an endowment like Columbia, which has leaned more to PE than VC.

Attribution of Select Endowments’ FY2024 Returns

Columbia’s return was likely mostly driven by its broad U.S. equity exposure, which is by our estimates and the school’s past reported allocations, among the highest in the Ivies. Additional exposure to stocks’ strength in 2024 stems from Columbia’s sizable hedge fund or absolute return portfolio, proportionally one of the largest allocations to the asset class amongst the elite endowments.

On the flip side, Columbia’s relatively low exposure to private equity, specifically venture capital, aided in expected outperformance of its peers. We estimate Columbia’s venture capital exposure to be the lowest of the elite schools.

Identifying Liquidity Risk in Fixed-Income Funds

Offering a practical framework for investment practitioners to screen and monitor liquidity risks in fixed-income products

Learn More
While Brown nearly matched Columbia’s return over FY2024, our models show they achieved that through very different means, and likely at very different levels of risk or portfolio volatility.

Brown’s outsized VC exposure, estimated at over 35% of the portfolio and maybe only superseded by MIT, was most likely a significant drag on performance. But the endowment’s small reported public equity exposure and likely a portion of their hedge fund portfolio[4] behaves as if it is significantly weighted towards technology. This IT exposure, which propelled Brown to the top of Ivies, acted to rescue the portfolio. By our estimates, exposure to the technology sector contributed 8% to Brown’s return, far and away the largest positive source of return.

As we see in the nearby Asset Class Exposures and attribution charts, Columbia shows a more balanced portfolio and likely sources of return over the recent fiscal year.

Risk Matters

Under Kim Lew’s stewardship since 2020, Columbia’s balanced diversification has contributed to the endowment showing the lowest risk as measured by annualized standard deviation over the 10-yr trailing window, both based on reported returns and MPI’s estimates. Brown trails only MIT in risk levels.

Indeed, from a risk-adjusted standpoint, Columbia’s long-term return efficiency through FY2023 was only exceeded by Yale—and slightly below the Global 70/30.

Brown, on the other hand, had the second lowest risk-adjusted returns return efficiency by our estimates.

*Sharpe Ratio calculation is based on a) 10-year reported annual returns and b) quarterly standard deviation estimates based on historical fund exposures (obtained through dynamic analysis of annual returns) and quarterly returns of risk factors over 10Y trailing estimation window.

So, while the two schools likely did well relative to peers in FY2024, they arrived via two different routes. CIOs, OCIOs, consultants, advisors and other asset managers, will surely note that takeaway.

We’ll be watching for more elite schools and up-and-coming endowments to report results, excited to plug results into our models in MPI Stylus Pro. And when schools publish annual reports (and hopefully asset allocations) later in the year, we’ll be reading with particular interest in discussions of distributions, liquidity and perceived opportunities in private markets, as well as increases in exposure to illiquid assets.

The divestment discussions are certainly worth paying attention to as well given their likely impacts on distributions and CIO’s ability to seize tactically upon opportunities that have arisen in the more normalized rate environment that defined recent fiscal years. At Brown, the fraught upcoming board of trustees’ vote on divesting from holdings tied to Israel, following an undisclosed committee recommendation, will be interesting to say the least. Should the trustees decide to divest and should the divestment movement eventually extend beyond the initial 10 suggested companies, Israel’s leadership in cloud security and Gen AI in particular, combined with the extent of tech sector exposure in Brown’s portfolio and venture capital allocations suggest a challenging process. Such paring could also be potentially painful from a returns’ standpoint should AI continue to propel the current bull market. Brown certainly wouldn’t be in its current leading role over the past decade without venture capital and technology exposure.

We’ll aim to update the MPI Transparency Lab as results come in. If you haven’t signed up for free access to this repository of data and analytics on elite endowments and pensions, please join us.

___________________________

Asset class figures and assumptions in this FY2024 initial report:

The preliminary Q2 2024 return for the Cambridge Associates Venture Capital Index is available from the CA website. The returns for Private Equity, Natural Resources, and Real Estate for Q2 2024 are projected using an autoregression model using public market indices: S&P 500, S&P North American Natural Resources Sector Index, and S&P 500 Real Estate Sector Index, respectively.

[1] Projected returns are based on FY2023 factor exposures and do not account for any potential portfolio adjustments nor asset class reallocations made during FY2024. Projected returns and related statistics are based on exposure estimates obtained through a returns-based analysis using MPI Stylus Pro and, beyond any public information, MPI does not claim to know or insinuate what the actual strategy, positions or holdings of the funds are, nor are we commenting on the quality or merits of the strategies. Deviations between our analysis and the actual holdings and/or management decisions made by funds are expected and inherent in any quantitative analysis. MPI makes no warranties or guarantees as to the accuracy of this statistical analysis, nor does it take any responsibility for investment decisions made by any parties based on this analysis. For further information and reports on institutions covered within, see the MPI Transparency Lab.

[2] Though Brown looked to be a top contender for the head of the class.

[3] Our Global 70/30 is comprised of 70% MSCI All Country World Index (ACWI) and 30% Bloomberg US Aggregate Bond Index. It is typical and reasonable to use a 70/30 for endowments instead of a 60/40 for pensions due to typically higher risk tolerance on the part of endowments vs the average pension. This post isn’t intended to address proper benchmarking, however.

[4]Public Equity is reported as 15% of the portfolio in FY2023, and an additional 21% is allocated to absolute return strategies (hedge funds).

Tags
Comments
  • Mike
    #

    Great post.

    However, your 2×2 graph of Risk/Return clearly shows that the 70/30 is the wrong benchmark for this group, it being a literal outlier. I bet that the 80/20 (or close to it) is the correct benchmark for this group. Do you agree?

    I strongly advise you use the correct benchmark in future posts – it feels like sandbagging, which doesn’t look good, especially for a shop that advertises itself as being “most advanced”.

  • Michael Markov
    #

    Excellent comment! This is exactly the kind of reaction we anticipated when we decided to present risk estimates alongside returns. How can one choose a benchmark when risk is sidelined? Unlike pension reports, endowment annual reports rarely mention benchmarks, aside from a simple aggregation of broad asset class results—equities, fixed income, etc. The Global 70-30 benchmark reflects the fact that endowments generally take on more equity risk than pensions. In fact, the entire purpose of the LAB (https://www.markovprocesses.com/product/mpi-transparency-lab/) was to create individual passive benchmarks for each endowment, given the wide range of allocations. I hope CIOs take note.

    Michael

Leave a Reply
Fields to complete: