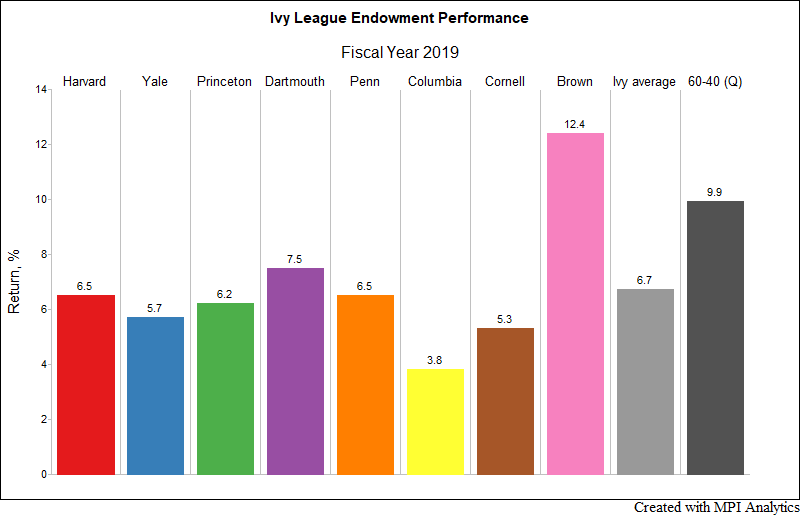
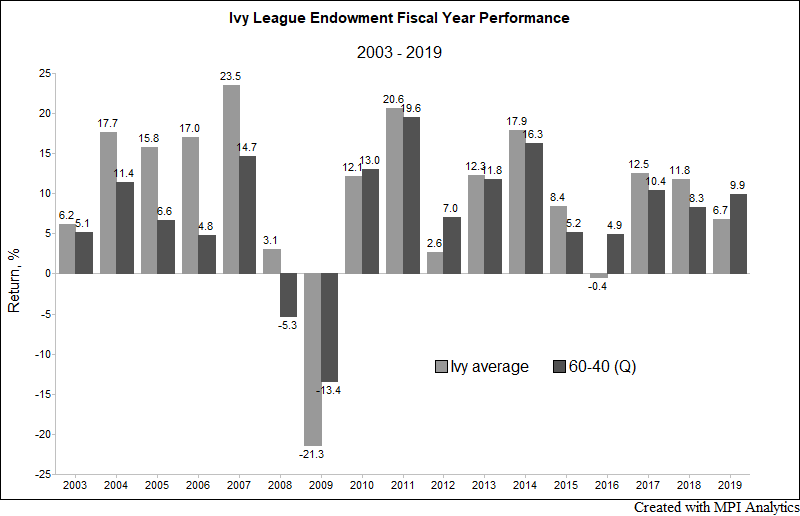
The Ivy average in FY 2019 was 6.7%, significantly underperforming the 60-40 and reversing two years in which they outperformed the traditional domestic benchmark (see our reports for FY2018; and FY2017). In fact, this (underperformance) happened only five times over the past 16 years:
Turning in an impressive 12.4%, Brown, which restructured its investment leadership roles at the beginning of the fiscal year, moved to the head of the class in FY 2019 after finishing in second place behind Princeton in FY2018, while the Tigers’ endowment, headed by Andy Golden, moved down to the middle of the class. Following a 6-year run of top or near top of the pack performance, Yale, led by legendary investor and progenitor of the “Yale Model” David Swensen, struggled for the third year in a row, returning 5.7% in FY 2019. Well into their 5-yr transformation under Narv Narvekar, Harvard landed in the middle of the class. Cornell, who have been transforming their investment office and portfolio in an attempt to overcome legacy challenges, turned in a 5.3% return, placing them above only Columbia, a system that has suffered turnover in the CIO seat since Narvekar left for Harvard and rounded out the bottom of the Ivy class this year with a 3.8% result.
FY2019 was a remarkable year for the public markets; the year saw a dramatic correction followed by a swift recovery in domestic stocks driven by a suddenly patient and accommodative Fed, and, relatedly, a volte face in fixed income markets with expectations for rates flipping from tightening to easing. The S&P 500 had its best first half of any calendar year since 1997, and in Q1 calendar 2019 the 60/40 had its best quarter in a decade. Variations from benchmarks and increased allocations to risk mitigation strategies, like hedge funds rather than, say, Treasuries, or reallocating domestic equity exposure to lower valuation segments of the global stock market, namely foreign developed and emerging markets stocks, would have challenged performance relative to a passive 60-40 portfolio.
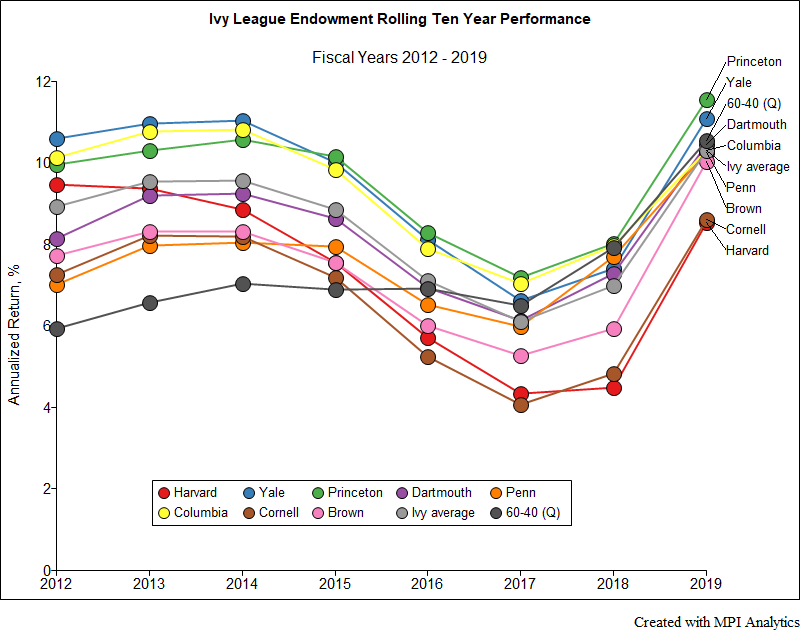
Paying too much attention to a single year is misleading though. For an endowment especially, given infinite time horizons, a decade can be argued to be shortsighted as well, especially one that has been comprised of a bull market in risk assets (the longest in history) and the longest economic expansion in history.
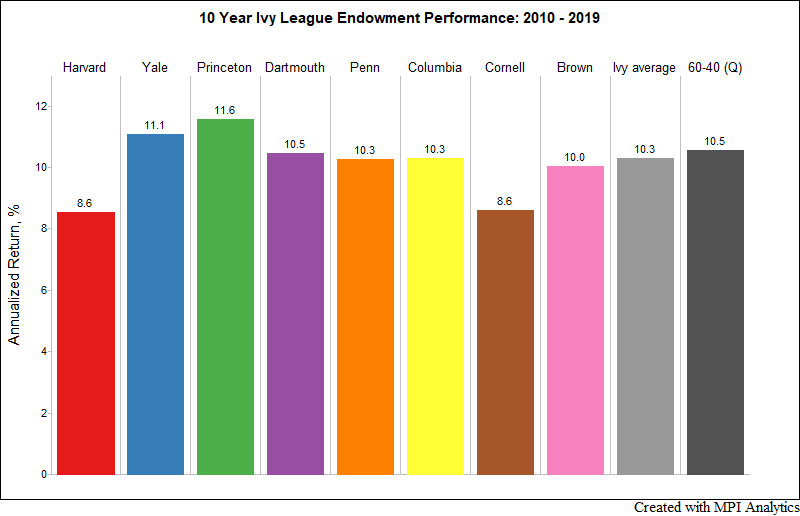
Over the past decade, from FY2010 through FY2019, the Ivy average of 10.3% slightly underperforms the 10.5% annualized return of the 60-40[3]. Dartmouth tied, while Princeton and Yale both bested the benchmark, returning an annualized 11.6% and 11.1%, respectively. And with a 10.3% annualized return over the past decade, Upenn and Columbia nearly matched the 60-40 in what has been a historic run for traditional assets supported by global monetary policy, and which has led many to argue that the Yale model of active management, private market exposures, absolute return strategies and high fees is outdated, especially when we factor in the potential risk involved in achieving such gains.
Also worth mentioning is that the Ivy average was 2% or 200bps below our FY2019 projection of 8.7%. Select individual schools, which can have an even greater margin of error given portfolio idiosyncrasies, underperformed expectations by an even wider margin. For example, our 10.1% estimate for Yale was well over and above the university’s uninspired 5.7% result.
What do we make of this gap? While we will both await 1) final Q2 2019 return figures for private market assets (early results for private equity and venture capital, namely, could prove to be overly optimistic) and 2) annual reports from select systems, we would point to two issues. First, is the role high fees and fee structures can play within alternative assets and funds. Though indices are net of some fees, the dynamics of the large number of funds in indices tend to cancel out those funds charging performance fees from those that did not hit hurdles or high water marks. Some schools’ private markets portfolios could have been hit with more fees than the average PE, VC or RE investor, as proxied by the benchmark indices And, unlike public funds which provide a lot of transparency into their fee structure, endowments may never shed light on their private investment expenses.
Secondly, markdowns around Q4 2018’s drawdowns may have depressed results. Managers may have moved to more aggressively mark assets to market following the drawdown in public markets, which tends to happen in down markets given PE’s forward bias – but which also may be symptomatic of overly valued private assets (for a very recent example, look no further than WeWork). Therefore, perhaps Ivies’ large exposure to those asset classes and strategies did not buoy performance as much as anticipated.
We will await final quarterly performance numbers for private market assets before issuing our final “Measuring the Ivy 2019” report. And we look forward to any additional disclosures that some of the endowments may provide in their annual reports, though we’re not holding our breath for many clarifying details from these opaque, revered and widely imitated endowment systems.
10/15/2019 2:36pm EST Update: previous version had Cornell (5.3%) and Columbia (3.8%) numbers flipped, which we corrected.
2/16/2020 6:16pm EST Update: some charts incorrectly stated FY2019 Ivy average as 6.9%, while the text had correct 6.7% number. The charts were updated to reflect correct information.
[1] The 9.9% return of a domestic 60-40 portfolio using the S&P 500 Index and Bloomberg Barclays U.S. Aggregate Bond Index, rebalanced quarterly, which we calculated. Some of our previous reports used daily rebalanced 60-40 and the difference in performance is negligible. As we’ve discussed before, the composition of the average endowment, and even pension, is often significantly varied from U.S. public equities and fixed income but it provides some measure of what a simple, liquid, low cost and diversified model could attain relative to the complexities, illiquidity and higher cost of the Ivy or Yale endowment model. For brevity, we are not suggesting an alternative, more appropriate benchmark in this piece of research.
[2] Endowments operate on fiscal year basis from July 1st to July 30th.
[3] 60% S&P 500 Index – 40% Bloomberg Barclays U.S. Aggregate Bond Index, rebalanced quarterly. Though minimal, this is gross of the fees required to maintain a rebalanced 60-40 market cap weighted passive portfolio.
[4] We are researching the impact of fees in alternative assets currently and hope to share results soon.