
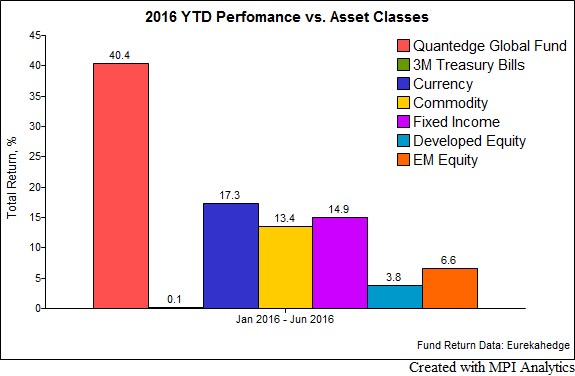
A July 20th WSJ article featured Quantedge Capital, a quantitative global macro hedge fund manager that gained 40% after fees year-to-date through June. The fund’s 2016 performance is outstanding indeed, as compared with major asset classes in the chart below (here and below we use the fund’s performance data from Eurekahedge):
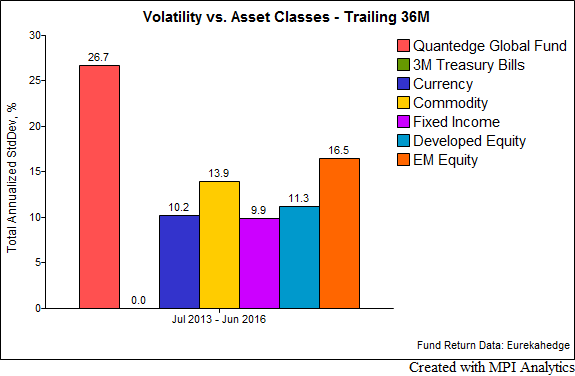
According to the investor letter cited in the article, the fund’s extraordinary returns were attributed to leveraged bets on fixed income securities. Such performance obviously comes with a cost – the article mentions 30% target annual volatility (standard deviation). Based on our analysis of the fund’s trailing 36 months of monthly returns, the volatility is in this range and is higher than any of the traditional asset classes – even emerging markets and commodities – as shown in chart below.
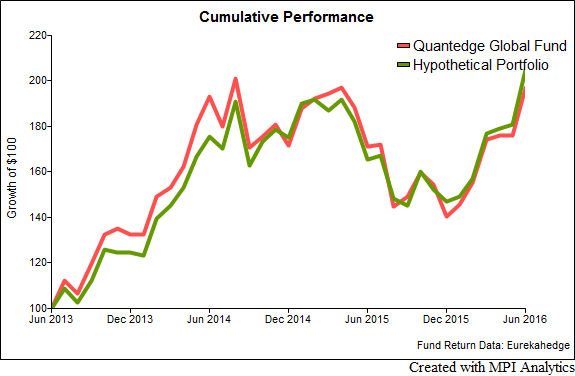
Now we will attempt to create a hypothetical portfolio of the major asset classes that would have delivered similar returns to Quantedge Global with a similar risk in 2016. Obviously, there are infinite ways one could explain a 40% six-month return by leveraging any of the asset classes above. However, if we also require that such a hypothetical portfolio mimics the fund’s return month-to-month over the past, say, 36 months – this becomes an infinitely more complex task. We used our Dynamic Style Analysis (DSA) to perform this analysis, the results of which are shown below. The resulting asset class “exposures” do not represent the actual positions that were held by the fund, but rather the combination of indexes that best mimic its returns. For an investor curious how such performance could have been achieved, it provides some useful insights. The chart below shows the product of the DSA analysis – a hypothetical portfolio of indexes that accurately captures the performance swings of the year-to-date period as well as the past 36-months.
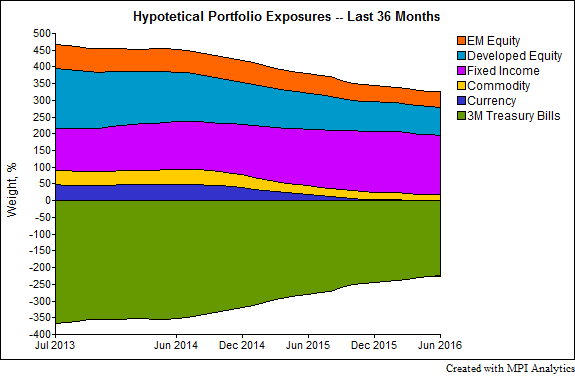
In the chart above, we show the fund’s asset class exposure changes over time: the long exposures are shown above 0 and the short exposures are shown below. We selected the market indices to represent four major asset classes that a typical global macro fund trades in, plus emerging market equity. The hypothetical portfolio demonstrates relatively stable historical exposures. It does show a gradual decrease in developed equity exposure and an increase in fixed income over time. As an investment portfolio, the short position of T-Bills represents leverage, as cash is borrowed to increase asset exposures above 100%. Here, the hypothetical portfolio’s leverage gradually declines from about 370% to 290% over time.

The above chart shows the performance of the hypothetical portfolio’s vs. the actual fund. Given this good level of tracking, one could view this hypothetical strategy as a plausible way that the fund’s results could have been achieved.
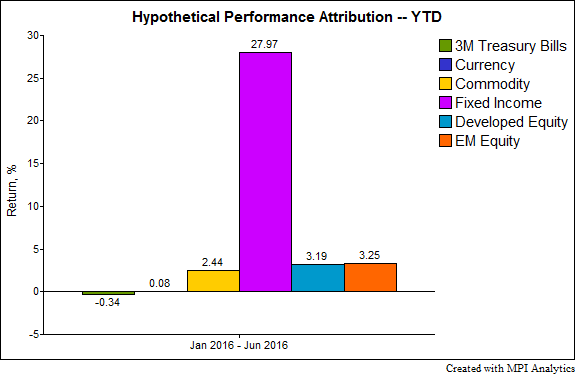
We also did a quantitative performance attribution analysis for the year to date period, shown in the chart below, to see how each asset class exposure contributed to the overall return of the hypothetical portfolio. One can see that gains from fixed income exposure dominated the YTD performance – similar to what was mentioned in the WSJ article.
For investors curious about how one achieves stellar returns year-to-date, the answer is, ”Yes, it’s doable.” However, it is critical to understand how a given product is achieving its extreme returns and carefully identifying the potential risks associated with its strategy. Only through this kind of analysis, can an investor understand how such a product can fit into a portfolio with other investments to achieve the overall desired properties.
________________________
DISCLAIMER: MPI conducts returns-based analyses and, beyond any public information, does not claim to know or imply what the actual strategy, positions or holdings of the funds discussed are, nor are we commenting on the quality or merits of the actual investment strategies. This analysis is purely returns-based and does not reflect insights into actual holdings. Deviations between our analysis and the actual holdings and/or management decisions made by funds are expected and inherent in any quantitative risk factor analysis. MPI makes no warranties or guarantees as to the accuracy of this statistical analysis, nor does it take any responsibility for investment decisions made by any parties based on this analysis.