Managed Futures: A John Bogle Moment?
Developed through a partnership with BarclayHedge, a unique investable benchmark delivers consistent performance and low risk, while preserving downside protection benefits of the managed futures strategies.
The benefits of investing in managed futures have been well-documented[1]. Incorporating this strategy into a portfolio can enhance returns, mitigate risks, and improve diversification[2]. But what is the best way to take advantage of the benefits of managed futures? The answer will vary from investor to investor, but our work has shown that a method of investing that’s very familiar and used by millions to access stocks and bonds also can work very well for managed futures.
That way is index investing.
Fifty years ago, index investing was nonexistent, and it took a visionary in John Bogle to create Vanguard Group in 1974 to provide low-cost investing options for investors. In addition to low fees, indexing brought another valuable prize – performance consistency – as both academics and investing professionals came to realize that active managers rarely beat their peers in a consistent manner.
Similarly, index investing in managed futures could provide investors a low-cost, transparent investment option with performance consistent and representative of the strategy, as we’ll see below.
Benefits of Managed Futures
In the table below, we illustrate the idea that incorporating managed futures in a portfolio can enhance returns, mitigate risks, and improve diversification by showing how, over the past two decades, adding a managed futures allocation to a conventional 60-40 equity-fixed income portfolio[3] could have decreased the drawdown and improved overall portfolio efficiency as measured by the Sharpe ratio. In these hypothetical portfolios, “MBEST20” refers to the MPI BarclayHedge Elite Systematic Traders Index (BLOOMBERG: MPBEST20), a non-investible index of hedge funds, which is used to model the managed futures allocation. This index comprises the 20 largest systematic trading strategies by AUM reporting to the BarclayHedge database and is specifically designed to serve as a more representative benchmark for an institutional portfolio of hedge funds focused on managed futures.
| Jan 2003 – Mar 2023 | Annualized Return | Annualized Std Dev | Sharpe Ratio | Max Drawdown Return |
| 60/40 Portfolio | 7.67 | 9.21 | 0.70 | -32.02 |
| with 5% MBEST20 | 7.58 | 8.84 | 0.72 | -30.19 |
| with 10% MBEST20 | 7.50 | 8.49 | 0.74 | -28.32 |
| with 20% MBEST20 | 7.31 | 7.88 | 0.77 | -24.48 |
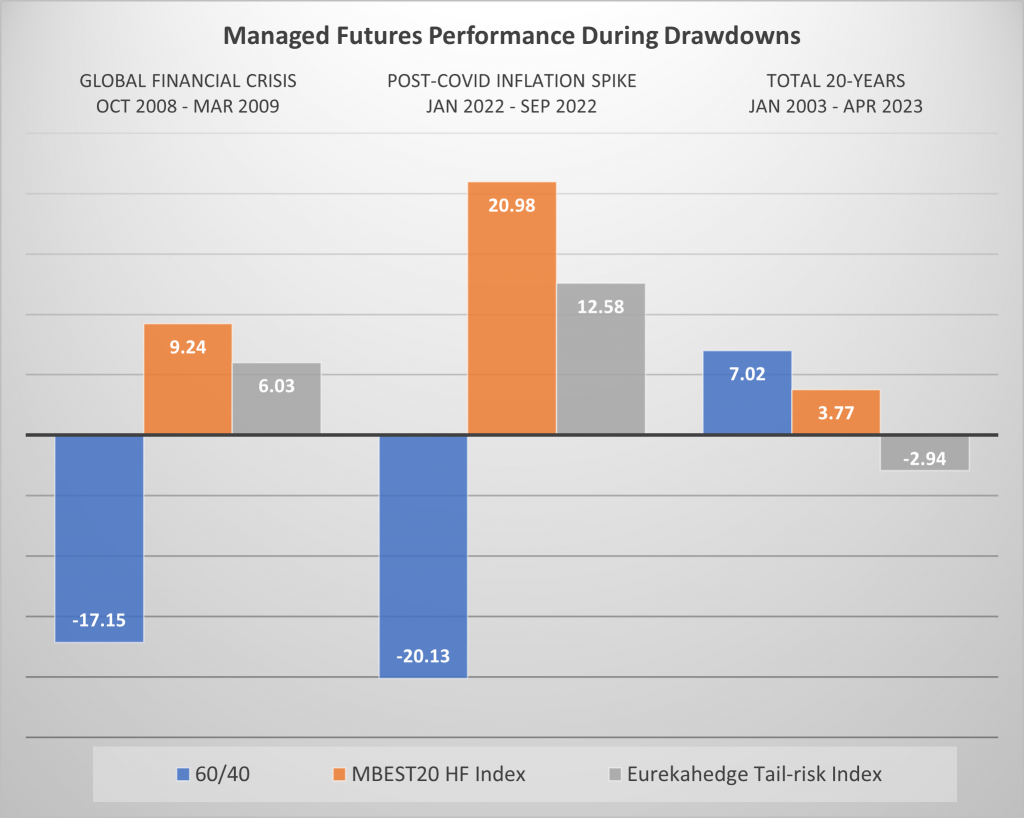
Over the past two decades, the MBEST20 index has produced notably attractive returns during major equity market drawdowns while delivering positive returns at other times,[4] as depicted in the chart below. This illustrates what would be significant benefits as a portfolio diversifier if the index were investible. Conversely, the put-buying strategy, which is represented by the Eurekahedge Tail-risk hedge fund index, offers protection during drawdowns but required a substantial 3% “insurance premium” (with annual performance at -2.94%) over the last two decades.
Challenges in Investing in Managed Futures
Although investing in managed futures funds can offer numerous benefits, it remains a challenging asset class for many investors. The primary reason is that investing in managed futures can carry with it a lot of investment and operational risk. Among the 20 top funds that constitute the MBEST20 index, 15 of them have exhibited risks greater than 15% over the past two decades, as measured by annualized standard deviation. This is acceptable and appropriate for certain investors but unsuitable, of course, for investors whose risk appetite is not as high. In contrast, for perspective, the risk of the Bloomberg Barclay Aggregate Bond index was 3.98% during the same period.
Additionally, a managed futures investment strategy can be seen as both complex and opaque by many investors who lack the resources for robust ongoing due diligence and monitoring. Trading approaches vary widely; some funds concentrate solely on precious metals, others may encompass every commodity, currency, and equity and even crypto, and there are many flavors (each with its own risk and reward profile) in between. Moreover, a strategy can be either long-short and fully automated quantitative or long-only and discretionary or something else entirely. Consequently, single-manager risk can be quite significant.
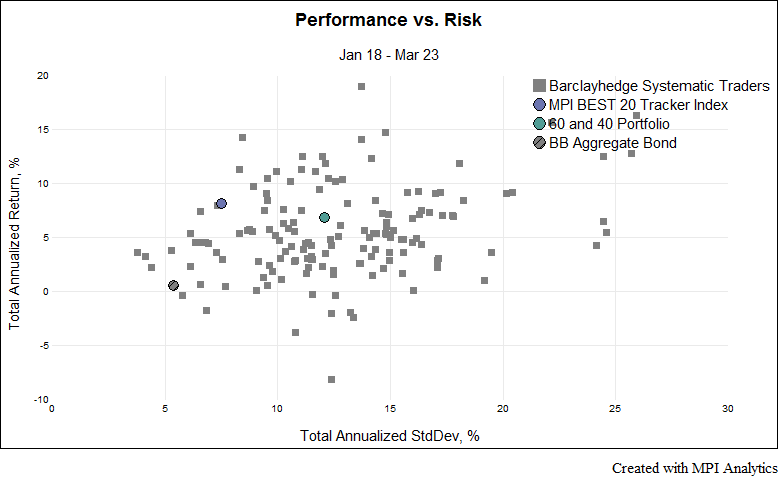
The chart below displays the risks and returns of 185 systematic trader funds reporting to the BarclayHedge database. These funds exhibit vast dispersion in both risks and returns over the past five years, making selecting the appropriate manager a challenge for investors. Investing in managed futures funds is generally expensive, as well, when compared to public funds. The top 20 funds in the MBEST20 index charge an average management fee of 1.5%, plus a 15% performance fee. Given that the top managed futures funds, as represented by the MBEST20 index, generate annual net returns of 5% on average (over the past 5 years – see chart below), the impact of fees can be quite substantial.[5]
MBEST20 Tracker Index: Index Investing in Managed Futures
Certain individual managed futures funds may be extremely well-managed and good matches for certain investors with unique portfolios and risk-reward preferences. Yet the difficulty of making this determination for many investors (and then re-assessing the determination over time) is one reason that, in 2018 Markov Processes International (“MPI”) partnered with BarclayHedge to develop the unique benchmark MPI BarclayHedge Top 20 Index (BLOOMBERG: MPBEST20), aimed at capturing the collective expertise of elite systematic traders. At the same time, using our proprietary technology and approach, MPI launched the MPI BEST20 Tracker Index (“BEST20 Tracker”; BLOOMBERG: MBEST20T) intended to capture the common trade signals of the elite group of 20 funds.[6] Besides being a representative strategy benchmark, the BEST20 Tracker – if implemented as an investment products – could provide investors with low-cost and investable access to the return streams of managed futures while avoiding single-manager risk.
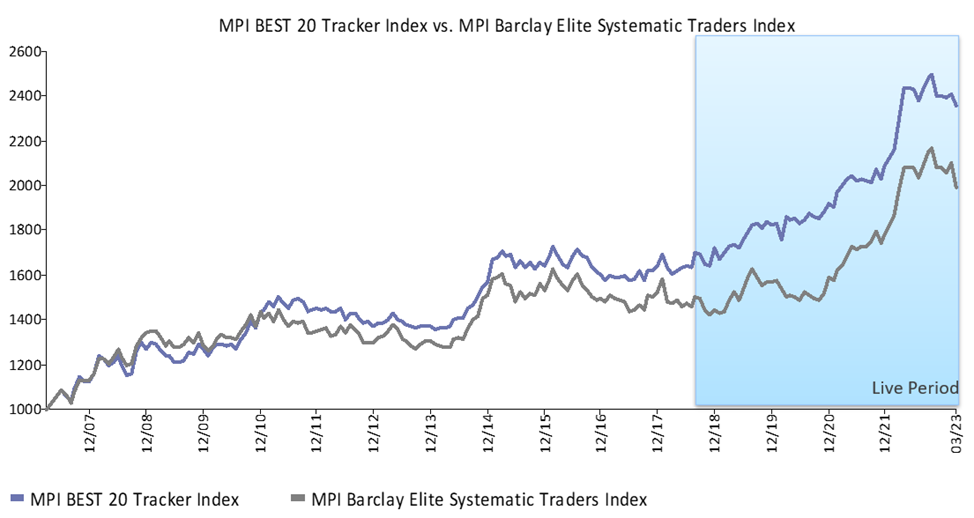
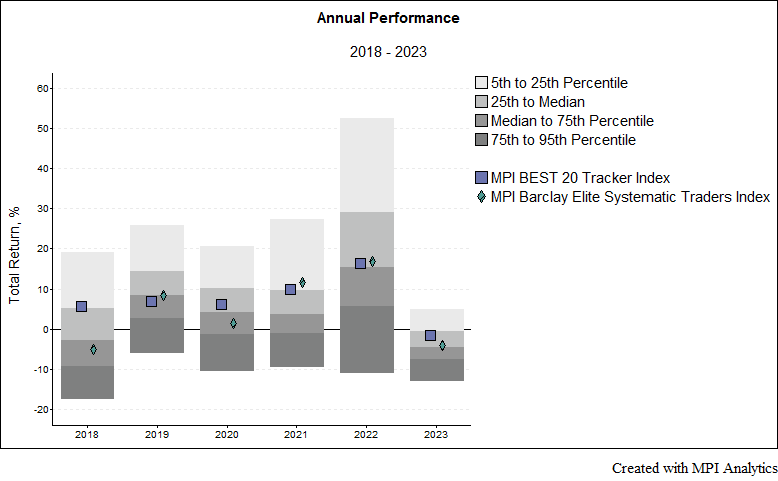
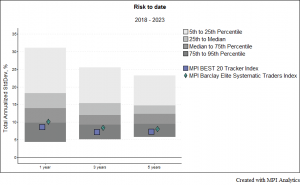
It is important to note that index investing in managed futures is possible. However, each way of doing this simply represents one (and only one) generic systematic trading strategy with predetermined set of assets and preset parameters[7]. As with both stock and bond index investing, many investors might want and benefit from what is essentially a consensus strategy instead. Along these lines, the BEST20 Tracker is designed to represent the shared ideas of the largest systematic traders (more on that below). The only requirement of the BEST20 Tracker is that it must track the index of actual hedge funds. As you can see in the charts below, it has delivered in this regard and closely mimicked the performance of its benchmark over time in both return and volatility since its inception.
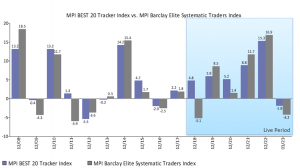
Betting on a single active strategy—whether it’s a long-only equity or a hedge fund strategy such as managed futures—requires a lot of expensive research and conviction. Index investing could be a lower-cost option which, when selecting the right benchmark, could help provide consistent performance and lower risk due to diversification. Indeed, when compared with the same 185 managed futures hedge funds depicted in the charts below, the BEST20 Tracker consistently outperformed 50% of the funds every year over the past five years. While surpassing 50% of all funds in the category may not seem like an impressive feat, it is essential to note that consistency is challenging to achieve. In the past five years, only one fund (John Street Capital Vantage Strategy) out of the 185 funds displayed similar consistency.
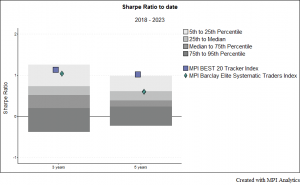
Moreover, the tracker attains such consistent performance while having risk lower than 80% to 90% of funds in the group. This is not surprising because, when it comes to managed futures, the diversification benefit is substantial as funds’ algorithms take at times opposite bets that cancel out in the index. What is left in the index are the common convictions of top traders. Consequently, the tracker has continually exhibited a superior Sharpe ratio, outperforming 75% or more of all systematic traders on a risk-adjusted basis. A high Sharpe ratio indicates superior efficiency as a risk diversifier.
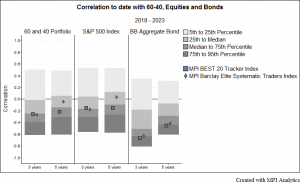
However, what’s more important is that the BEST20 Tracker is maintaining the same diversification properties of the target index of elite hedge funds which makes these strategies attractive to investors, particularly when both stocks and bonds are down.
In the chart below we show correlations of both the MPI BarclayHedge Elite Systematic Traders Index and the BEST20 Tracker with the 60-40 portfolio as well as S&P 500 Index and Bloomberg Barclay Aggregate Bond Index over the trailing three and five years. The tracker maintains consistently low (negative) correlation with equities and bonds in particular – similar to that of the target index of hedge funds.[8]
John Bogle’s family lost most of its savings in the 1929 market crash, and Jack’s early education had to be financed by his uncle[9]. Bogle devoted his life to providing investors access to low cost and consistently performing indices and spurred what has become a $10 trillion market. If the Vanguard S&P 500 index fund had existed in 1929, it wouldn’t have saved the Bogles from tremendous losses…but a portion invested in something like the BEST20 Tracker could have helped.
[1] “Managed Futures: A Risk-Off Solution?”, by Aric Light, CFA Institute December 2022
[2] “The Potential Role of Managed Commodity-financial Futures Accounts (and/or Funds) in Portfolios of Stocks and Bonds”, by John Virgil Lintner, 1983.
[3] 60% S&P 500 Index, 40% Bloomberg Barclays Aggregate Bond Index, quarterly rebalanced.
[4] Put-buying strategies also have good downside protection, but do not provide positive returns in aggregate periods.
[5] The impact of fees is even more pronounced for FoF and Multi-advisor funds which have muted performance caused by offsetting bets of diverse set of trend-following strategies. This also can be observed among liquid alternative mutual funds. The average net expense ratio for the ten largest (by AUM) managed futures mutual funds is 1.5% (Source: Morningstar; as of April 2023). However, some managed-futures funds of funds in a mutual fund format charge additional 1-2% management fee and 15%-35% performance fee on the individual fund level. These fees sometimes are not disclosed in the prospectus and are not incorporated into the standard mutual fund expense ratio calculation.
[6] MBEST20T tracker is rebalanced weekly and priced using a diversified set of highly liquid instruments spanning equities, commodities, fixed income and FX.
[7] Please see “Credit Suisse Liquid Managed Futures Index” and “Loomis Sayles Managed Futures Index” as representative examples of investible managed futures indices.
[8] We present correlations rather than covariances for simplicity and scale. More precisely, the diversification power of an asset is proportional to covariance of the asset with the portfolio. However the covariance charts will produce similar results given that the volatility of the tracker and the index are similar.
[9] https://successstory.com/people/john-bogle


