Markov Processes International

Measuring The Ivy 2020: First Take

Well, it’s that time of the year… All Ivy endowments’ results for the fiscal year (FY2020) that ended June 30, 2020, are in and, while we’re still waiting for the final Q2 numbers for private asset benchmarks to take a deep dive on Ivys’ performance drivers, some important observations can already be made.

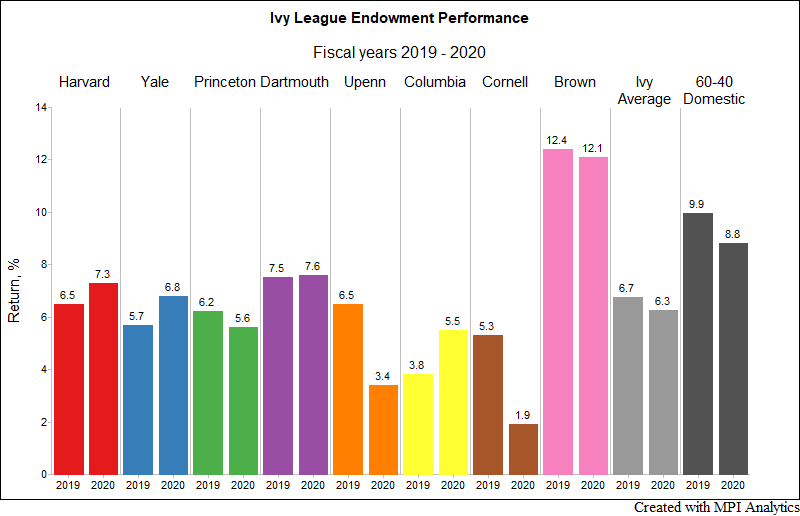
For the second consecutive year, all Ivy endowments (save for Brown) and the Ivy average underperformed a 60-40 portfolio of US domestic stocks and bonds: Ivy average return for FY2020 was 6.3% vs. 8.8% for the 60-40 quarterly rebalanced portfolio of the S&P 500 Index and Bloomberg Barclays US Aggregate Bond Index. This year’s results show significant dispersion among the eight-member Ivy League schools – even wider than last year’s. Brown pulled way ahead of the pack for the second straight year, boasting 12.1%, while the lowest return among Ivies was reported by Cornell, coming in at 1.9%. Ivy endowment results have been fairly consistent for the past two fiscal years with the exception of Penn and Cornell – both exhibiting a significant drop in returns in FY2020 as compared to FY2019.

At first glance, such consistency of performance for the last two wildly different years is unexpected, until we look at the asset class performance over the same time period.1 Domestic equities, bonds, private equity and hedge funds (assets that dominate Ivy endowment portfolios) have shown similar consistency over the past two years. At the same time, Real Estate, Commodities as well as Foreign Developed and Emerging Equities, saw a significant drop in performance vs. FY2019, which may have impacted the lower performing Ivies.

Moreover, from a pure number perspective, the 2020 fiscal year market behavior was a total repeat of 2019 – albeit shifted by a quarter – despite all the economic and human hardships caused by a global pandemic. We illustrate this remarkable phenomenon in the chart below by superimposing S&P500 Index quarterly cumulative results over the past two fiscal years beginning in July of the respective year: 2018 for the FY2019 and 2019 for the FY2020.

As we’ve mentioned in our previous research, the sheer size of the largest endowments causes them to behave as index funds, with asset allocation explaining a dominant portion of endowment return movements, both in magnitude and variability. Therefore, such remarkable consistency of Ivy returns for the two consecutive years shouldn’t come as a surprise. As we’ve done it previously in 2015, 2016, 2017, 2018 and 2019, in our upcoming 2020 annual report we will be dissecting the annual endowment returns into asset class performance drivers to quantify and explain the difference in results between the schools.

Given their long-term-focused investment approach and that the dominant portion of the Ivy’s assets are tied in illiquid private investments, the 10-year (10Y) horizon provides a more appropriate framework for comparison, leaving year-to-year fluctuation of Ivy grades to be somewhat distracting. In addition, valuation delays and gaps in reporting for private assets make short-term performance comparisons with public market benchmarks less accurate. The FY2020 Ivy average annualized 10-year returns was 9.5% – slightly below the domestic 60-40 portfolio 10-year results at 10.1%. After a tie in FY2016 (both posting 6.9%), the Ivy average underperformed the passive 60-40 benchmark on a ten-year rolling basis, for the fourth fiscal year in a row.2

The following chart could provide a simple back-of-the-envelope explanation for the observed trend in longer-term endowment results. We show rolling 10Y performance for the Ivy average vs. that of 60-40 and compare it with long-term 10Y annualized performance of assets that dominate Ivy endowment portfolios: Domestic Equities, Private Equities, and Hedge Funds. One could observe that the gap in long-term performance between public and private assets is steadily declining, while the gap between the 60-40 benchmark and hedge funds is widening. These two facts alone could explain the “flip” in the rolling 10-year performance in FY2016 of the “Ivy Average” and “60-40 Domestic” lines.

While some might argue about the reasons for the observed trend, such as diminishing alpha and lower illiquidity premiums for private equities, increased market efficiency affecting hedge fund performance, etc. the fact is that, on average, the Ivy endowment model’s advantages are declining.

There are some notable exceptions though. Princeton (10.6% 10Y return) is the only Ivy that has consistently outperformed 60-40 long-term despite the aforementioned trends. Yale (10.9% 10Y return) outperformed 60-40 on 10Y-basis every year except for 2018. Brown has been a stellar performer for the past two straight years, despite having a similar asset allocation to some other Ivies. In our FY2019 endowment report, we linked the wide dispersion of results to the extremely wide range of  returns of private investments that constitute a significant part of many of the Ivy’s portfolios. Below is a chart taken from this report showing the range of annual outcomes for large PEs being consistently around 70%! Fund selection risk in private equity is staggering, not to mention this being a 10+ years commitment.

Such investment selection risk puts a greater emphasis on due diligence when sourcing alternative investments – private equities in particular. Quantitative analysis, for example, can help explain the gap in performance results between PE funds – whether it’s leverage or sector allocation decisions. Previously, the use of quantitative techniques, such as Returns-Based Style Analysis (pioneered by MPI in the early ’90s), has been limited in their application to private investments. However, MPI’s soon-to-be-released new Private Equity model is promising to decipher complex private equity funds and separate skill from luck and leverage. By using only fund performance data, such quantitative technique – being objective and scalable – brings the same level of transparency to individual private equity funds as it does for complex fixed income strategies and hedge funds. Please stay tuned for our upcoming research in this segment!

Edited 10/29/2020 2:48 pm: incorrectly stated that Dartmouth and Yale outperformed 60-40 on 10Y basis every year.

Footnotes

Exit mobile version