Markov Processes International

On Fireworks and Smoke Screens

The Wall Street Journal celebrated July 4th by publishing an article listing US Fund managers who had significantly outperformed during the ongoing rout of the market (“The Few Mutual-Fund Managers Who Avoided the Debacle”).

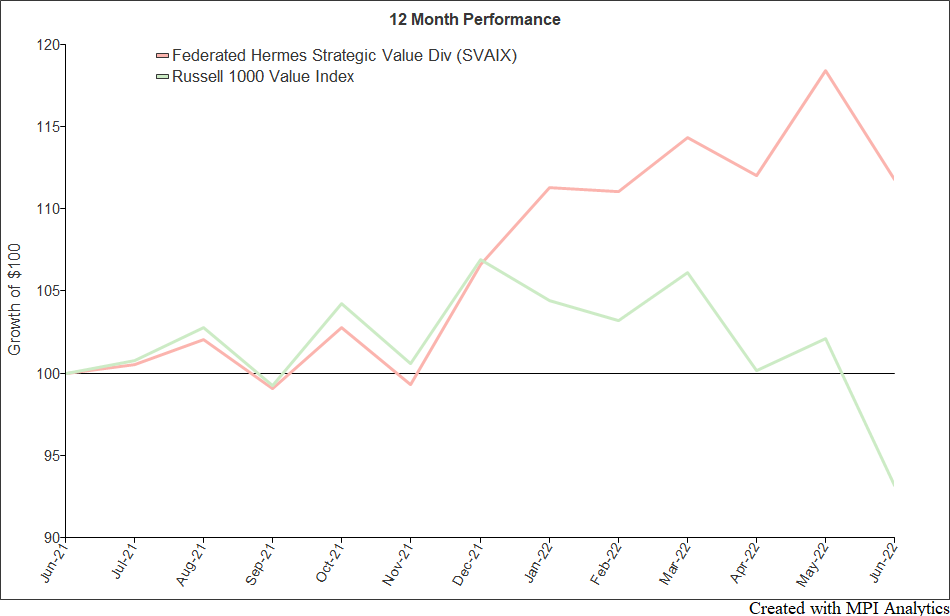
One fund, in particular, got the reporter’s attention because it outperformed all of the rest of the 1,342 actively managed US stock mutual funds tracked by the WSJ. Federated Hermes Strategic Value Dividend Fund (SVAIX), managed by Daniel Peris, returned 11.8% for the 12 months through June 30th vs. a -6.8% loss for the Russell 1000 Value Index and an -8.6% loss for the S&P500 Index.

An Impressive Run

In the chart below, we confirm the SVAIX’s remarkable results vs. the Russell 1000 Value Index over the trailing 12 months; in early 2022 the index dives (and dives, and dives) while the fund takes off and outperforms by 18.6%.

So, what’s the explanation for this tremendous run? The article points to the strategy reflected in the fund’s name – strategic value dividend – wherein the portfolio manager is focused on the highest-dividend paying stocks. The article notes, for example, that the fund has a “4.53% dividend yield, well above index levels of 2.3%.”A good explanation, and certainly a nice writeup for Mr. Peris.

It’s Not Lonely at the Top

It’s just a shame the article stopped at active funds and did not explore further. Case in point? The WisdomTree High Dividend ETF (DHS) employs the same general strategy at an expense ratio of only 38 bps. As the chart below demonstrates, it seems to mimic the results SVAIX is enjoying (albeit without the WSJ write-up.)


ETFs may be “passive” investments because they don’t involve regular human intervention, and we understand why that can be a very good thing. Just ask famed quantitative shop AXA Rosenberg, which was brought down by a single human error. But let’s not forget that many ETFs employ similar investment rules to active managers when all is said and done.

Digging into Performance

The article’s graphic shows a massive waterfall pulling down sailing ships while only one chugs ahead without disaster; the caption reads, “The top mutual fund for the past 12 months, Federated Hermes Strategic Value Dividend Fund, was powered by its focus on dividends.” In this environment, 18% outperformance is certainly a good way to avoid disaster. But clearly, there must be something more to it than a 2% higher dividend yield than other managers.

It seems obvious that if a portfolio manager or a screening algorithm focuses on dividends alone, this may lead to certain sectors being over- and underweight, even within value stocks. To identify such bets, we will turn to Dynamic Style Analysis (DSA), MPI’s advanced returns-based style analysis methodology.

Below we show the results of such an analysis using 12 months of daily returns for the SVAIX and the WisdomTree ETF, plus the Russell 1000 Value index, using S&P500 sector indices, and foreign indices to account for the fund’s documented exposure to UK and Canadian stocks.

Note remarkably similar sector exposures for the Federated Hermes fund and the WisdomTree ETF. As compared to the Russell 1000 Value, both portfolios have massive exposures to Consumer Staples, Energy, and Utilities; much less to Health Care and Financials; and not much at all to other sectors. As is the case with returns-based analyses, a significant cash position is not reflecting the actual cash but rather what traders call “beta adjusted exposures,” which means that the stocks in the portfolio have a much lower beta to the corresponding S&P sector index than the stocks in the index. This could be an artifact of selecting high dividend yield stocks within each sector.

Dissecting the cumulative performance relative to (in excess of) the Russell 1000 Value index in the chart below, we could see how in early 2022, the Energy, Consumer Staples, and then Utilities contributed to both the fund’s and ETF’s outperformance. This chart is driven by over/under-weighting times over/under-performance of each index vs the Russell index.

It is remarkable that all contributions cumulatively landed in the positive territory by the end of the 12-month period. This means that even all underweighting of sectors vs. the benchmark ended up being positive because the underweighted sectors underperformed.

The chart below shows the 12-month excess performance of each sector vs. the benchmark index. Energy, Consumer Discretionary, and Utilities were the top performers, while the bottom performers – sectors to which neither the fund nor the ETF had any significant exposure – were Communication Svc and Consumer Discretionary.

Note that the combined outperformance in the above chart comes in at about 14%, short of the actual 18.6% outperformance number. This is because we didn’t account for cross-product in computing cumulative attribution.

So, congrats to Mr. Peris and the folks at Federated Hermes; it’s a strong performance and will make for great marketing. But whether it’s a hedge fund with a 40% return or a traditional fund that’s outperforming the market, investors would do well to remember two things.

Firstly, it’s all about over- and underweighting. And second, your fund selection process is only as good as the blind spots in your screening criteria. Just ask the folks at Wisdom Tree…they may not be actively managing, but as active managers so often like to say, you can’t argue with results.

DISCLAIMER:

MPI conducts performance-based analyses and, beyond any public information, does not claim to know or insinuate what the actual strategy, positions or holdings of the funds discussed are, nor are we commenting on the quality or merits of the strategies. This analysis is purely returns-based and does not reflect actual holdings. Deviations between our analysis and the actual holdings and/or management decisions made by funds are expected and inherent in any quantitative analysis. MPI makes no warranties or guarantees as to the accuracy of this statistical analysis, nor does it take any responsibility for investment decisions made by any parties based on this analysis.

Exit mobile version