Red vs. Blue: How the 2024 Election Tax Proposals Could Affect Your Wealth
How will each party tax proposals impact the wealth of Middle Class and High Net Worth households?
It’s not that obvious. And the answer may surprise you.
The upcoming election offers differing visions of America’s future. Both candidates have offered policy proposal regarding their tax policies. At MPI, we asked the question:
How will each parties tax proposals impact the wealth of Middle Class and High Net Worth (HNW) households?


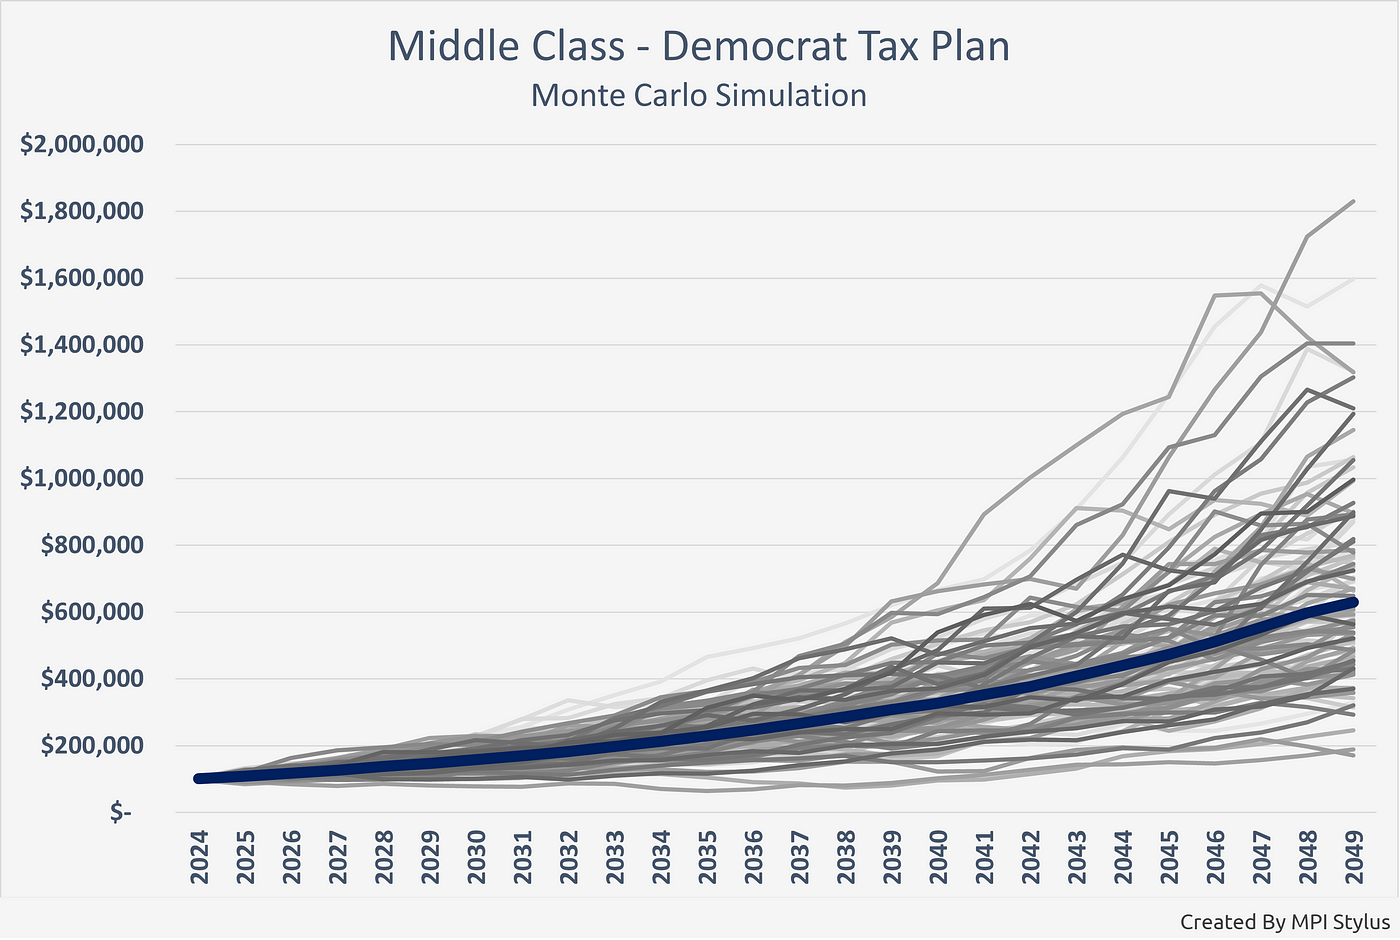
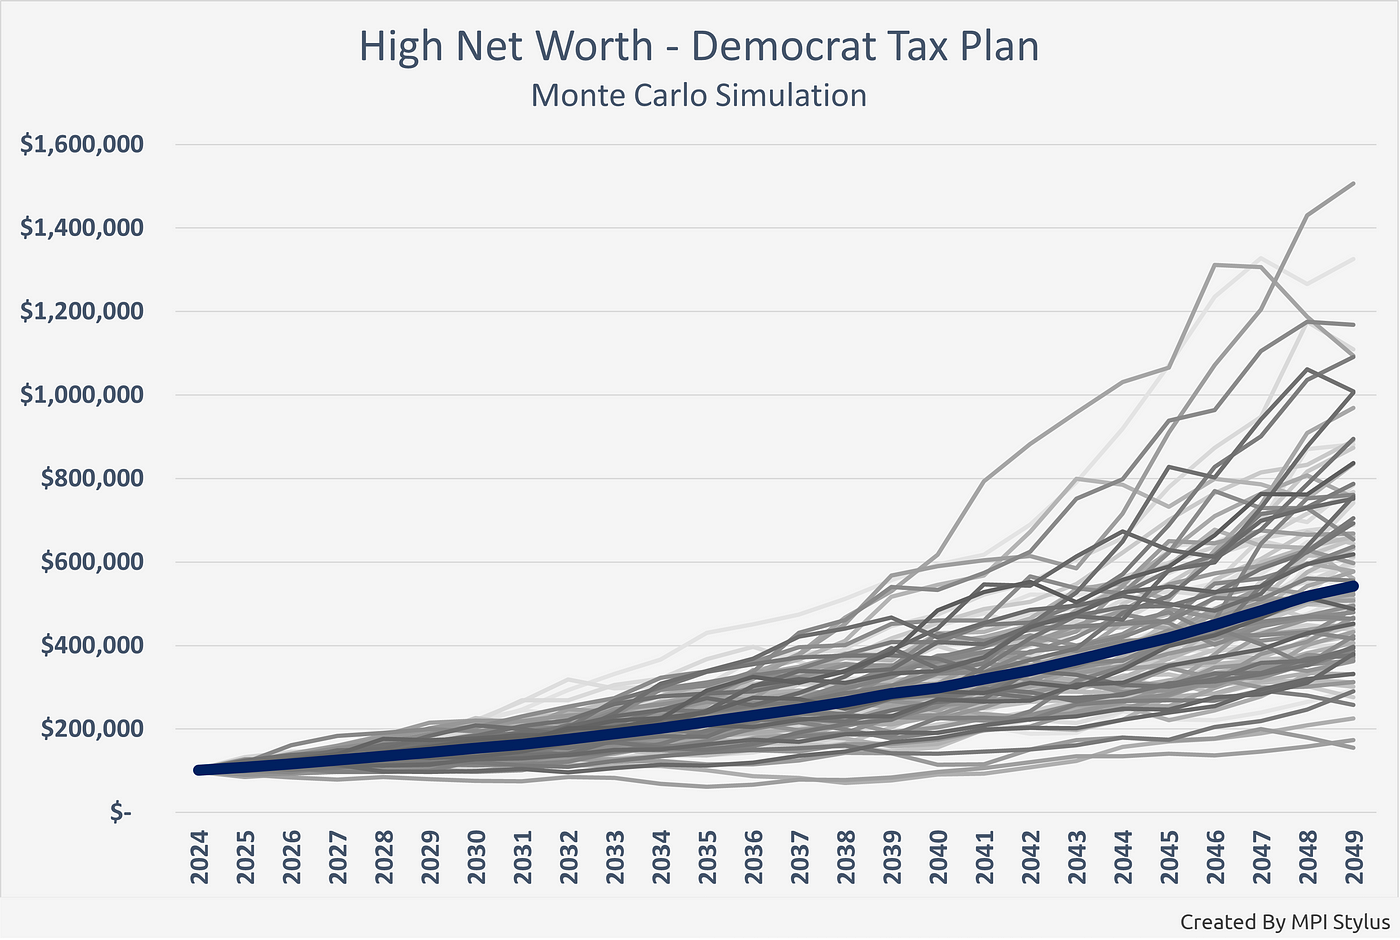
For Middle Class households, our analysis expects the Democrat tax proposal to yield a higher return. The opposite is true for High Net Worth (HNW) households.
Methodology
Using MPI’s Stylus Analytics Platform, we apply a Monte Carlo Simulation in MPI’s Asset Allocation tool, assuming a lognormal distribution to create wealth projections of the same $100,000 portfolio of stocks, bonds, and commodities for both households over the next 25 years. We then apply four distinct tax scenarios to the outcomes.²
We picked the median value from the simulations.
Middle Class Households:


High Net Worth Households:


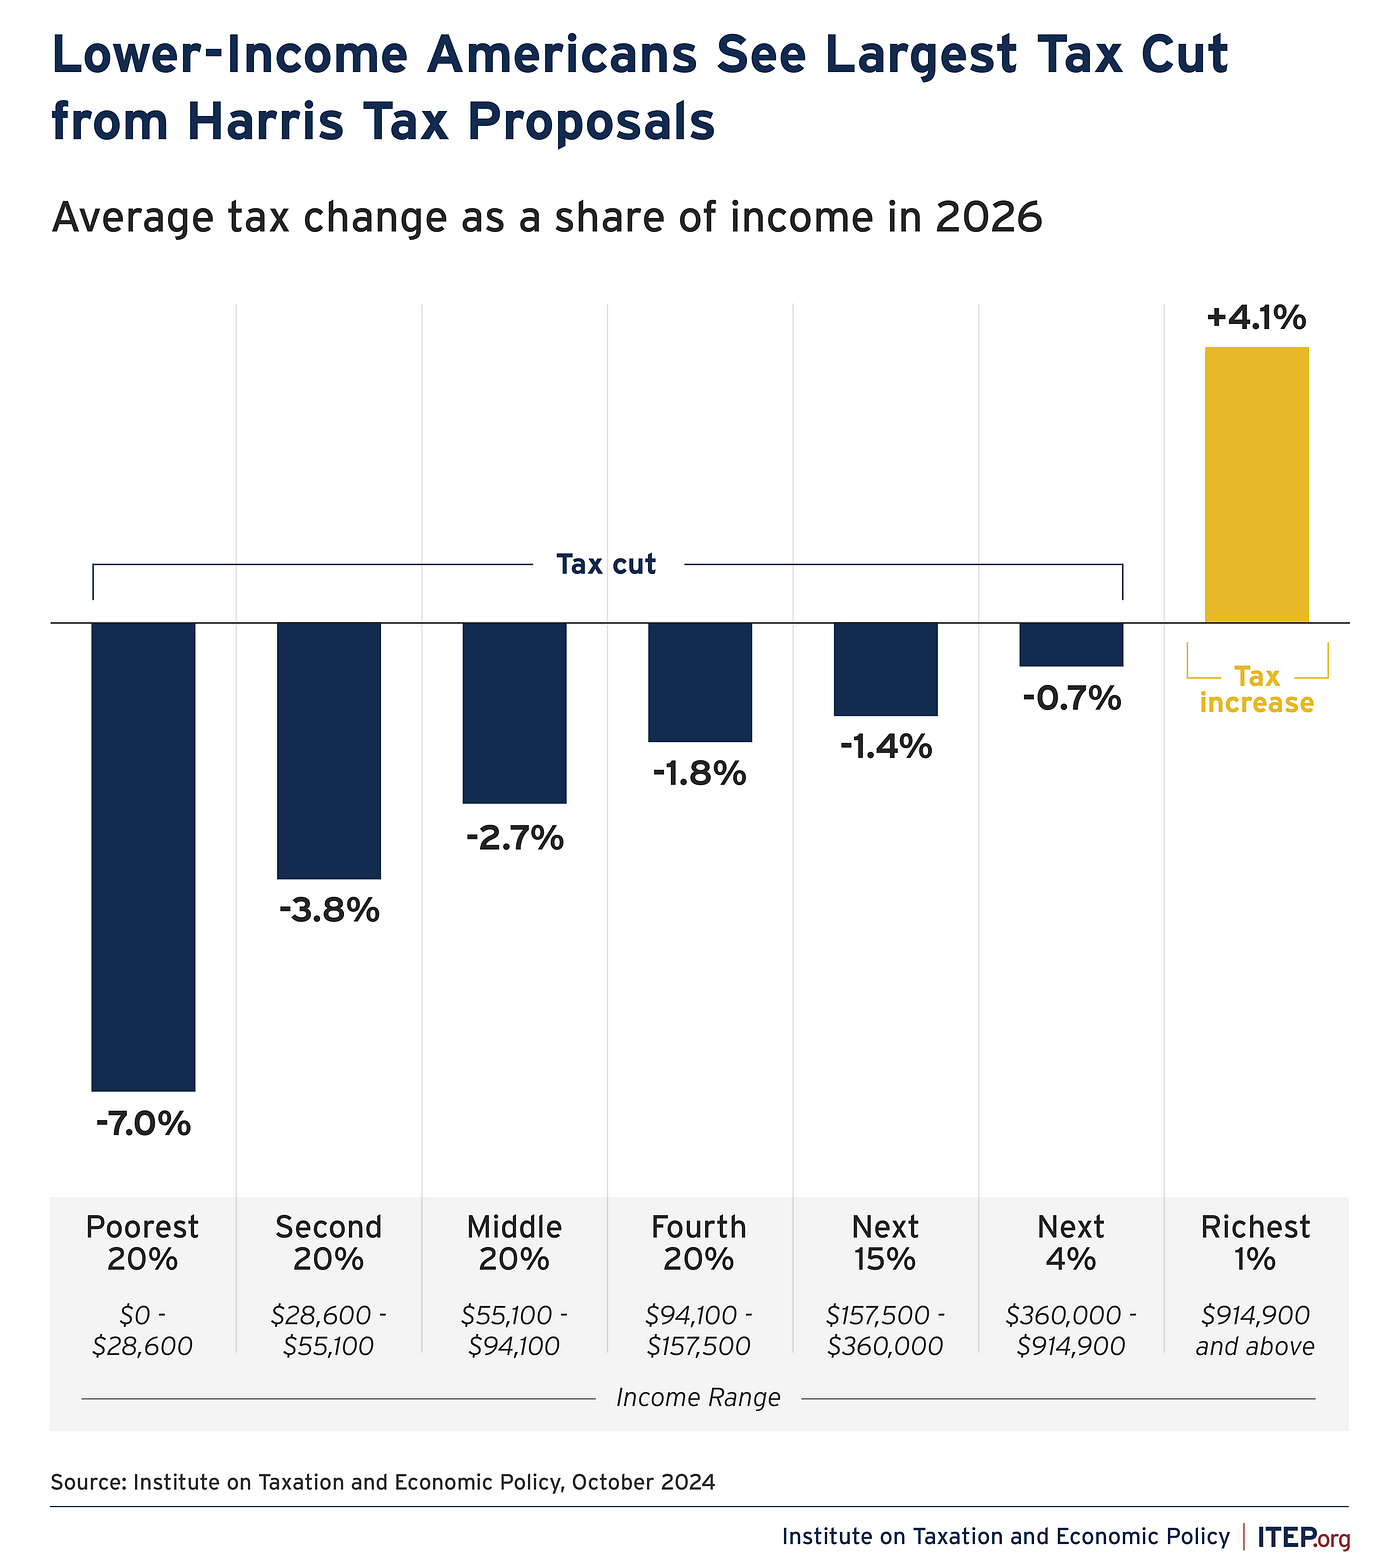
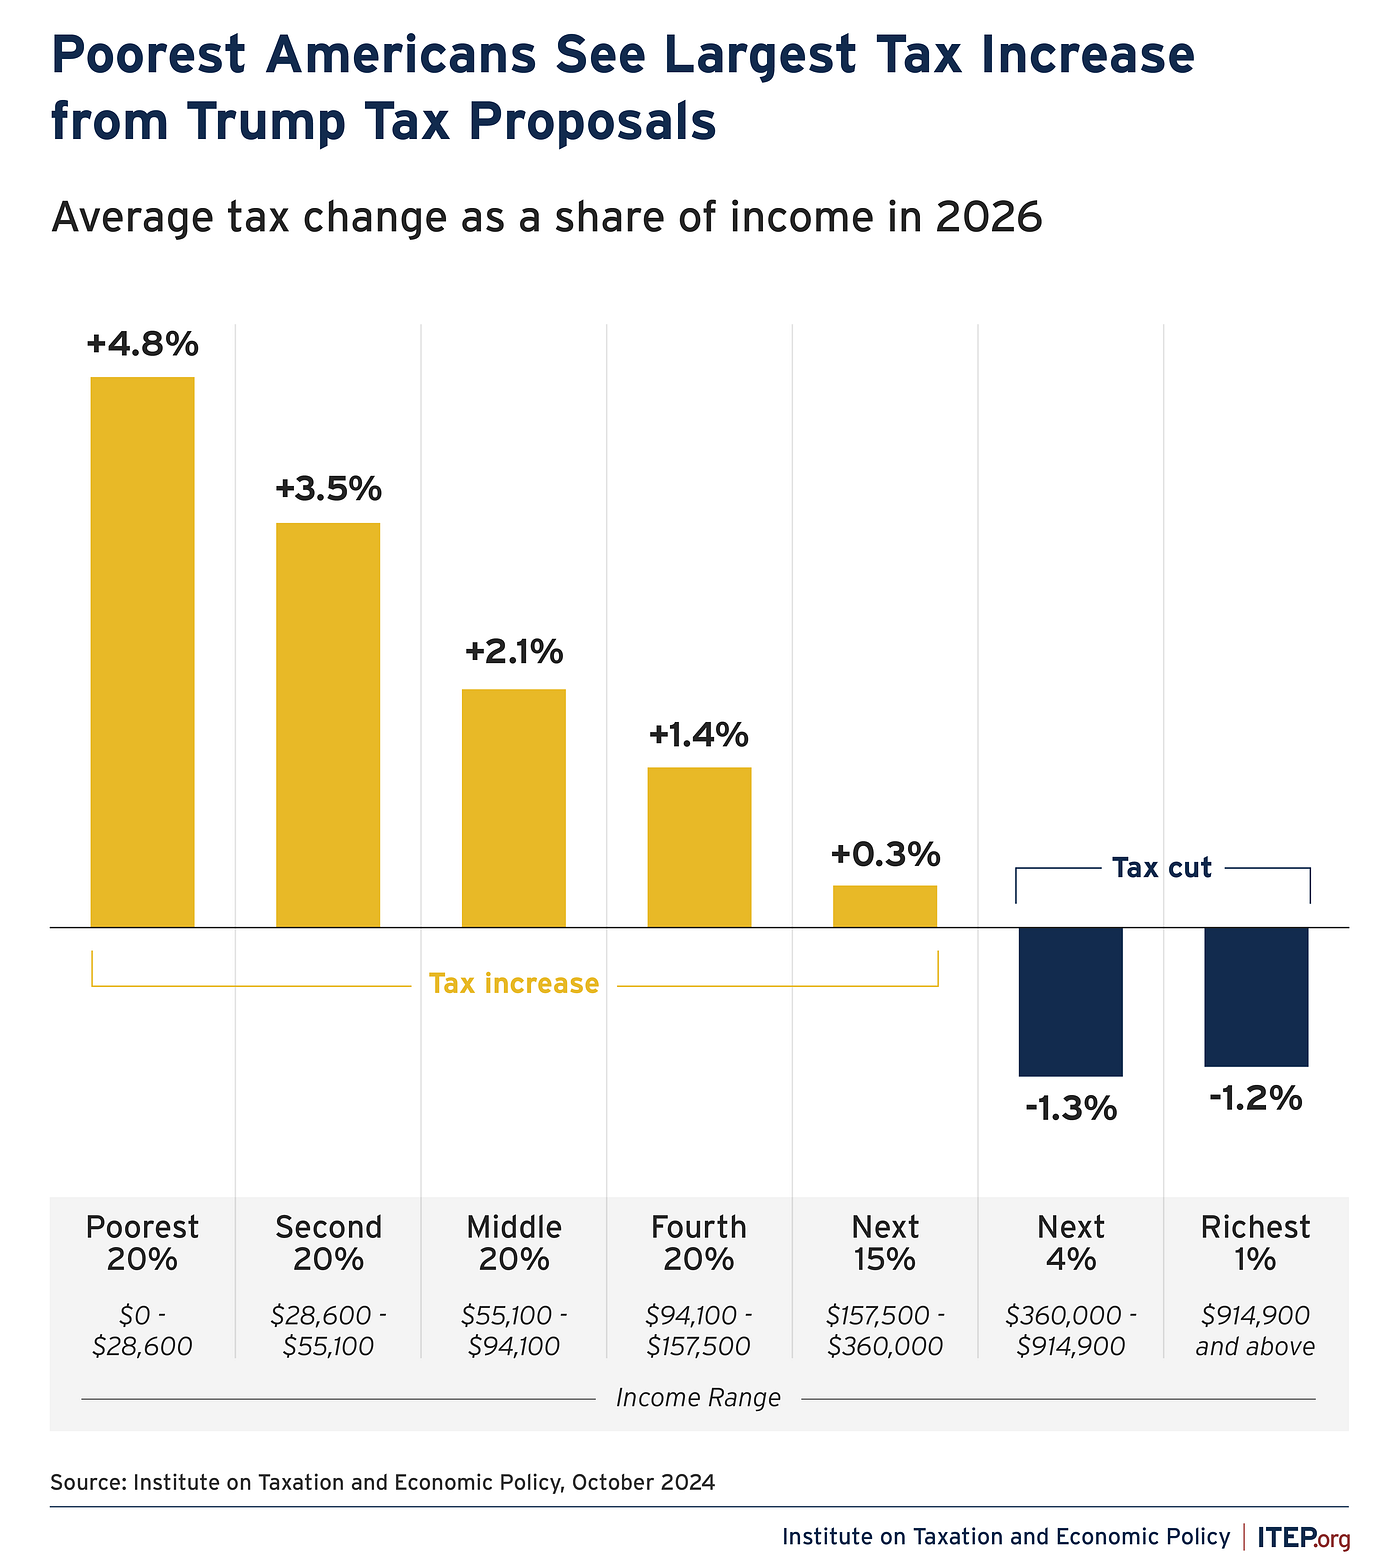
Each Candidates Tax Plan Assumptions:
Kamala Harris

Donald Trump

About MPI

How We Did It
Analysis was done using MPI’s Stylus Platform. MPI Stylus solutions are among the most advanced investment research, analysis, and reporting technologies available in the market. They are used by hundreds of institutional investors, consultants, asset managers, government regulators, and retirement plan advisors to make smarter investment decisions.
MPI now offers tax-adjusted simulations to provide more realistic projections of future wealth and returns for taxable portfolios. Learn more about how firms use MPI for Asset Allocation and Portfolio Construction.
Footnotes
[1] The balanced portfolio is 60% Global Equities, 30% US Fixed Income, 5% Commodities & 5% Cash.
[2] We use one of three tax rates applicable to an individual investor for each asset in the portfolio, Marginal Income Tax, Capital Gains, and Qualified Dividends. For the different outcomes, we added/subtracted the ITEP estimated incremental tax burden/benefit from the current 2024 rates for these income brackets. Current 2024 rates used were Middle Class: 24% income and 15% for capital gains and dividends and HNW: 37% income and 20% for capital gains and dividend.
Disclaimer
MPI makes no warranties or guarantees as to the accuracy of this statistical analysis, nor does it take any responsibility for investment decisions made by any parties based on this analysis.


