

Investors have a tendency to downplay interest rate sensitivity as a factor influencing equity products, with the assumption being that its effect must be negligible at most.
One of a handful of exceptions to that assumption, however, is concern over the rate sensitivity of low volatility “smart beta” funds. We mentioned this in a previous post and predictions and concerns of underperformance in a rising rate environment have been cited in several industry publications, including Pensions & Investments and ETF.com.
Steady recent increases in the Federal Funds Rate prompted us to conduct an analysis of some common quantitatively managed “strategic beta” strategy ETFs. Our goal is to identify their recent1 sensitivities to changes in the headline 10-Year Treasury Constant Maturity rate.
Estimated using MPI’s proprietary Dynamic Style Analysis2, the following table presents both the average and range of exposures3 across funds to changes in the 10-year Treasury yield for each of five common strategies4.
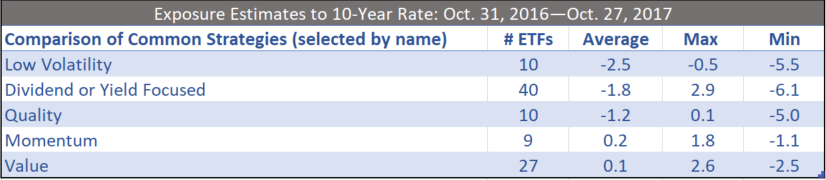

These betas can be interpreted similarly to how bond duration is interpreted. That is, all else being equal, a beta of -5 indicates that a 100-basis point increase in 10-year yields results in a fund return of -5%. Put another way, such a product would have approximately the same duration as a five-year, zero-coupon bond. The difference, of course, lies in the fact that all else is never equal. And unlike with bonds, a number of other factors (broad market, size, sector, style, etc.) are important drivers of their returns.
That’s not to say that rate sensitivities are unimportant for equities. In fact, low volatility ETFs, in particular, tend to show a meaningful and consistent sensitivity to rising rates. The chart below displays the interest rate exposure estimate for each ETF within this group. We also show a Russell 1000 ETF for comparison.
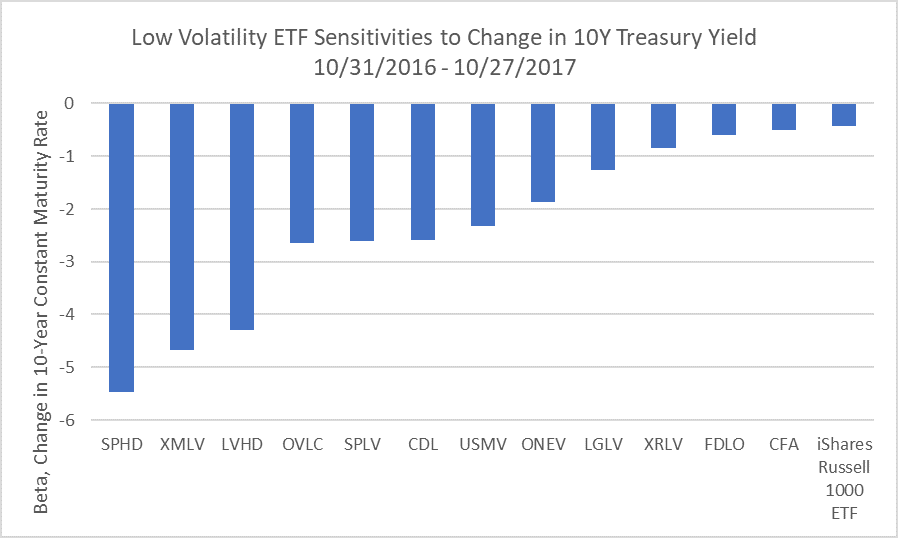

The range in magnitude is somewhat surprising, and it has real implications for investors. In the latter half of 2016, the 10-year Treasury yield saw a run-up of 123 basis points between July 8 and December 15, from trough to peak. However, simply showing low volatility ETFs’ (under)performance for this period could be misleading, given the other factor exposures involved.
Style analysis allows us to easily decompose a fund’s returns by factor contribution. In the chart below, we show three pieces of information for each fund, using the start of the common analysis period until the recent peak in 10-year yields. The 10-year yield rose 76 basis points over this period, from 1.84% to 2.6%.
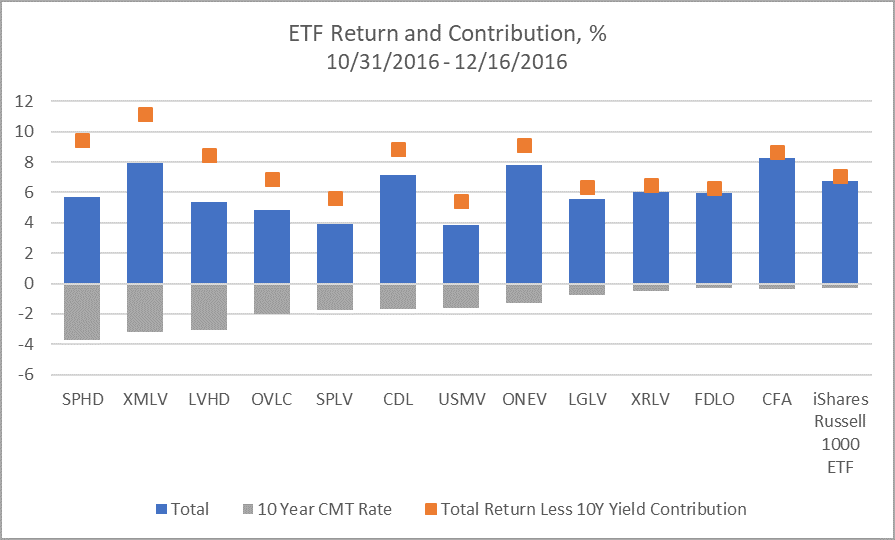

As expected, we see that the (negative) contribution of the increase in yields (grey) to the ETF returns is proportionate to the beta estimates in the first chart. We also see that total returns (blue) vary greatly and appear generally independent of the rate sensitivities. In essence, returns are positive despite the large negative contribution from rising interest rates, unlike the negative return we would see from bonds. Finally, we see an approximation of what each ETF’s returns might have been without the yield influence (orange), say if the rate exposure had been perfectly hedged without any additional cost. Most of the return differentials are substantial and illustrate a real drag on performance.
Each of these products has a different approach to construction and/or factor focus, which explains the disparity in exposure estimates. Powershares has three ETFs on the list: one which combines low volatility and high dividends (SPHD), one which tracks the oldest and most straightforward index—the S&P 500 Low Volatility Index (SPLV), and one which directly addresses the issue of rising rates—the S&P 500 ex-Rate Sensitive Low Volatility portfolio (XRLV5). Their rate sensitivities range from highest to middle to among the lowest, respectively.
The resulting sector weights from the different methodologies play a large part in explaining varying rate sensitivities in these products. The ETF with the largest rate exposure, SPHD, has over 40% of its sector exposure in Utilities and Real Estate—by far the two most rate sensitive GICS sectors. At the other end of the spectrum, the ex-Rate Sensitive product, XRLV, has one of the few rate exposures that isn’t statistically significant at the 10% level, and its magnitude is the third smallest. This ETF effectively excludes both Utilities and Real Estate sectors.
While some products listed above provide a pretty good nominal hint of how they invest, names in general are not an adequate indicator of construction or expected behavior. For example, three of the 12 funds (SPHD, LVHD and CDL) have a nominal income focus as well as low volatility. Two of those (SPHD and LVHD) register among the highest rate exposures, while the third (CDL) ranks among the lowest. It is also unclear which other factors (value, size, profitability), if any, are considered in each product—and several do include others. Finally, a number of weighting methodologies exist across this group of funds, ranging from simply weighing securities by the inverse of their historical volatility to optimization with various sector, tracking, and/or individual security constraints.
It does appear that interest rates matter to equity products, some more than others. The most likely culprits seem to be low-volatility and yield-focused “smart beta” funds, which is not surprising given some common sector concentrations. There is a wide range of rate sensitives within this group, however, which demonstrates the impact of individual construction and specific factor combinations.
By analyzing these products to detect meaningful differences in their exposures to various risk factors, investors are better positioned to evaluate their impact on overall portfolio performance.
Footnotes
- 1Defined as an average over the past 52 weeks.
- 2DISCLAIMER: MPI conducts performance-based analyses and, beyond any public information, does not claim to know or insinuate what the actual strategy, positions or holdings of the funds discussed are, nor are we commenting on the quality or merits of the strategies. This analysis is purely returns-based and does not reflect actual holdings. Deviations between our analysis and the actual holdings and/or management decisions made by funds are expected and inherent in any quantitative analysis. MPI makes no warranties or guarantees as to the accuracy of this statistical analysis, nor does it take any responsibility for investment decisions made by any parties based on this analysis.
- 3The factor model used for all analyses employs the Fama-French 5 factor model, Momentum and the change in the 10-year Treasury yield.
- 4The ETFs used were determined using the following filters in the Morningstar database: Category is either Large or Mid-Cap Equity, all styles; Has at least 52 weeks’ return history as of August 31st, 2017; Description contains words relevant to the strategy (i.e. “Momentum”, “Value” or “Volatility”). There is a slight overlap between some groups, as a handful have a dual focus, and it is possible that some relevant products were omitted.
- 5There are two other rising rate equity ETFs, both with shorter history and not expressly focused on volatility (EQRR and FDRR).