Solving the Biggest Puzzle of the 2024 Endowment Season
Using quantitative analysis and MPI Stylus Pro to determine how Michigan State managed to outperform just about everyone
MSU Common Investment Fund (CIF) Annualized Returns as of June 30, 2024
| wdt_ID | wdt_created_by | wdt_created_at | wdt_last_edited_by | wdt_last_edited_at | Endowment/Bmk | 1 YEAR | 3 YEARS | 5 YEARS | 10 YEARS |
|---|---|---|---|---|---|---|---|---|---|
| 1 | Michael Markov | 03/26/2025 01:55 PM | Michael Markov | 03/26/2025 01:55 PM | MSU CIF Return | 15.1 | 5.9 | 12.1 | 9.3 |
| 2 | Michael Markov | 03/26/2025 01:55 PM | Michael Markov | 03/26/2025 01:55 PM | NACUBO 1B-$5B, Upper 95% | 15.1 | 5.9 | 11.4 | 9.1 |
| 3 | Michael Markov | 03/26/2025 01:55 PM | Michael Markov | 03/26/2025 01:55 PM | NACUBO >$5B, Upper 95% | 12.3 | 5.4 | 11.5 | 10.0 |
| 4 | Michael Markov | 03/26/2025 01:55 PM | Michael Markov | 03/26/2025 01:55 PM | Ivy Endowment Average | 8.1 | 2.5 | 10.2 | 8.9 |
| 5 | Michael Markov | 03/26/2025 01:55 PM | Michael Markov | 03/26/2025 01:55 PM | 70/30 Global Benchmark | 14.2 | 3.0 | 7.6 | 6.5 |
In October of 2024, Michigan State University’s $4.4 billion endowment stunned the investment world by announcing a 15.1% return for the fiscal year ending June 2024, outperforming every Ivy League and other elite endowments tracked by the MPI Transparency Lab. By comparison, the top-performing Ivies, Columbia and Brown, reported returns of 11.5% and 11.3%, respectively, for the 2024 fiscal year, while the 70/30 Global Benchmark returned 14.2%.[1]
The NACUBO 2024 study, released on February 26, 2025, provides data from 658 U.S. colleges, universities and affiliated endowments for the 2024 fiscal year. According to this study, MSU’s endowment outperformed roughly 95% of all 119 endowments with assets of $1 to $5 billion over 1-, 3-, 5- and 10-year periods. It is likely the only endowment in this category to achieve such a remarkable result.[2] Although it is not in the $5 billion-plus AUM bracket (which contains 30 schools), the only endowments in that cohort that MSU has underperformed over the trailing 10 years are Brown (10.8% 10-year return), MIT (10.5%), Yale (9.5%), and Dartmouth (9.5%). However, over 1- and 3-years MSU outperformed all four schools and over 5-years MSU underperformed only Brown.
MSU Endowment facts
The MSU Common Investment Fund (CIF) is a pooled fund of the university’s long-term investments, with its endowment as the largest component.
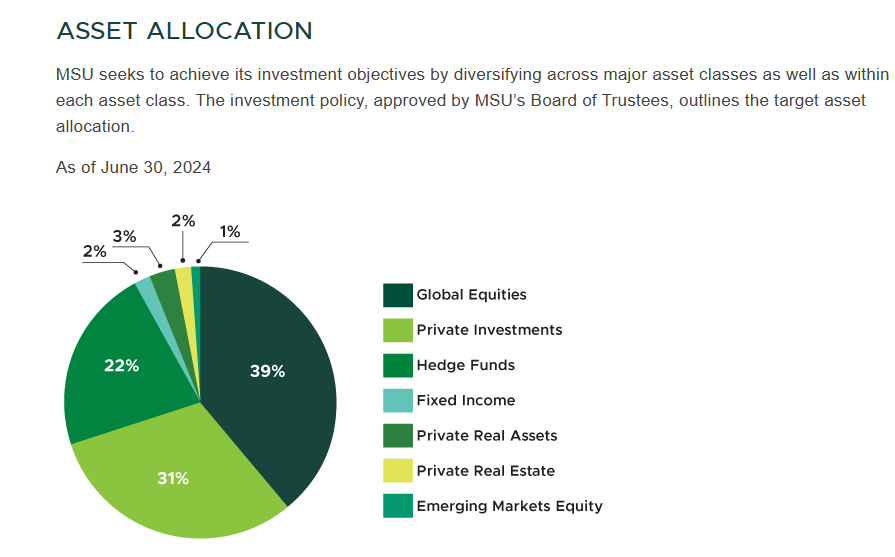
As of June 2024, the MSU CIF’s main allocations are to Global Equities (39%), Private Investments[3] (31%) and Hedge Funds (22%). Despite its significant position in alternative investments, MSU’s portfolio differs from a typical Ivy League endowment as it has minimal exposure to Fixed Income (2%) and Real Estate (2%). While many Ivy League endowments allocate significantly more to real estate (e.g., Yale), MSU has a lower allocation to private equity[4] and a higher allocation to public equities and hedge funds.
Assess a fund’s potential exposure to complex hypothetical market shocks or historical regimes.
Given the struggles alternatives faced in FY2024, these asset allocations alone could not have produced a 15% return. Thus, there is more to this story. In a recent interview, Dr. Zecher humbly attributed his results to luck as well as the build-out of the U.S. equity position but hasn’t provided any solid performance attribution figures. That’s where quantitative analysis is extremely helpful.
MPI Stylus identifies the sources of MSU’s top performance
Our analysis focuses on the sources of MSU’s outstanding performance. When faced with such questions and anomalies, our clients turn to MPI Stylus Pro, a performance “reverse-engineering” platform dubbed a “storyteller” by many. Using a fund’s NAVs or returns, as well as returns of major asset class indices, our technology helps validate strategies and reveals the sources of returns and skill (or lack thereof), without requiring portfolio holdings, which are often unavailable, unreliable, or out of date.
The challenge with endowments is that most colleges and universities publish only annual data, making this analysis extremely difficult.[5] However, we were able to scrape MSU’s endowment returns from its website dating back to FY2011, which proved to be sufficient (if any Michigan State University officials or alumni are reading this, providing data prior to 2011 would improve the quality of our analysis).
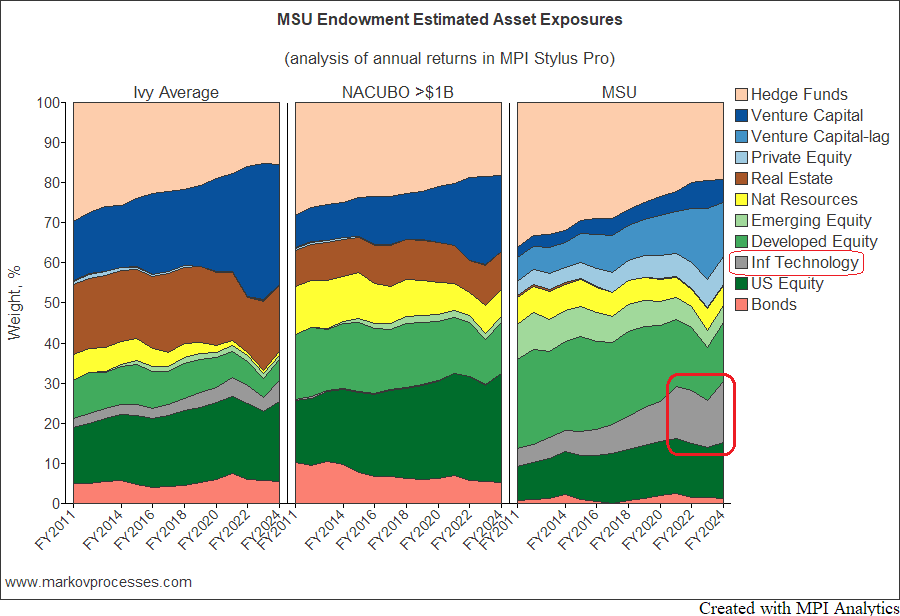
Our Asset Exposures chart below presents historical asset class exposures derived from MSU’s annual returns,[i] comparing them with Ivy League averages and other large endowments tracked by NACUBO.
Key Observations on MSU Asset Exposures
- MSU’s disclosed asset allocations align with our findings: substantial exposures to public equities, hedge funds, and private investments, a small exposure to natural resources, and minimal real estate and bond weights.
- The most striking factor is MSU’s significant overexposure to Information Technology stocks (in grey) the highest among elite endowments tracked by MPI Transparency Lab. This mirrors Brown University’s endowment strategy, though MSU’s tech exposure appears even greater.
- This tech-heavy equity exposure may stem from direct equity investments, technology-focused hedge funds, or technology-focused venture capital (VC) and private equity (PE) funds.
- MSU has a notably higher hedge fund exposure than Ivy League endowments, though it has declined over time.
- MSU holds a higher allocation to public equities compared to Ivy League averages, particularly in international equities (both developed and emerging markets).
- Unlike its Ivy and large endowment peers whose exposure to private investments is typically dominated by venture capital, MSU endowment shows some exposure to PE.
A Potential Anomaly in Private Assets Reporting Detected
A surprising insight from our analysis is that MSU’s venture capital portfolio shows a potential reporting lag. We usually add a quarter-lagged series to the set of factors and let the machine learning engine assess its credibility. Our results show that the dominant portion of MSU’s endowment VC exposures are driven by quarter-lagged valuations: MSU’s venture capital exposure comes primarily from the lagged VC index while Ivies and other largest endowments show exposure only to standard (non-lagged) VC index.
Offering a practical framework for investment practitioners to screen and monitor liquidity risks in fixed-income products
According to its consolidated financial statements, the MSU Common Investment Fund (CIF) is invested in hundreds of L.P. interests. This means its private capital investments are implemented through a number of pooled investment vehicles, such as funds of funds, rather than through individually selected funds. This high level of diversification gives even more credibility to our findings.
While such valuation lags are typically associated with accounting and reporting practices, they could also indicate the average vintage age of MSU’s VC portfolio is consistently lower (younger) than that of standard VC indices. Regardless of the reason for the lags, the delayed valuations may have contributed to the MSU endowment’s exceptional performance.
The MSU website has the following footnote that might support our findings:
“(2) Information includes private investment managers that have reported performance for the most recent quarter, however quarterly updates may be delayed by up to ninety days due to the timing of investment manager reporting.”
Since we do not have access to CIS private asset valuation reports, we cannot determine whether this result is merely a correlation anomaly or a genuine issue—especially given that we are working with only a few annual returns. Quarterly returns, if available, could provide a more robust analysis. However, this is precisely where our clients see the value of such quantitative analysis—not in accepting things at face value but in raising important questions.
Liquidity Analysis
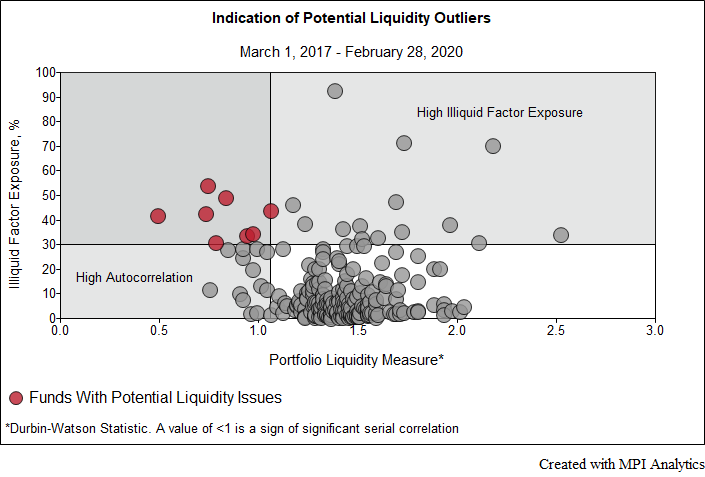
Our recent research article, A Private Equity Liquidity Squeeze By Any Other Name, highlights that many large endowments are experiencing a liquidity crunch due to their significant commitments to private equity along with dried-up distributions from private investments. It also provides a framework for measuring such stress.
Based on our back-of-the envelope calculations from MSU’s FY2024 financial statements, CIF’s unfunded commitments to PE as of June 2024 totaled $637 million, with a total PE allocation of $1,401 million. This means PE commitments account for 31.3% of the combined allocated and committed amount. This ratio serves as an indicator of liquidity stress—the higher it is, the more likely the endowment will need to seek liquidity elsewhere to fund its PE commitments. For comparison, the average Ivy League endowment has a ratio of 25.7%, with Columbia the second highest at 31.3%, matching the MSU CIF.
Another aspect of the liquidity issue is liquidity pain, measured by the ratio of unfunded commitments to liquid assets. We typically exclude hedge funds from liquid assets because capital calls are typically funded within weeks, whereas hedge fund redemptions must be planned months in advance. MSU’s financial statements provide clarity on hedge funds’ lack of liquidity: “A de minimis amount of the hedge funds have restrictions that do not allow for redemption in the first 12 to 60 months after acquisition. The remaining restriction period for these investments ranged from 5 to 24 months at June 30, 2024.”
To estimate liquid assets, we added MSU’s cash position to its equity allocation, arriving at a total of $1.37 billion. Another approach is to use the reported asset allocation breakdown and apply the percentages allocated to global and emerging equities (40%) and fixed income (2%) to the $4.4 billion in reported FY2024 CIF assets, yielding a total of $1.85 billion. Dividing the $637 million in unfunded commitments by our low and high estimates of liquid assets results in a liquidity pain number between 46% and 34%. For comparison, the average Ivy League endowment has a liquidity pain of 44%, with Princeton and Harvard at 52% and 60% respectively. This suggests that MSU’s liquidity pain is comparable to that of large endowments but not at the level that will force MSU to raise money in bond market as other private-equity-heavy endowments have done lately.
We anticipate that redemptions from the liquid equity allocations will be used to partially fund capital calls, leading to an increase in the PE/VC allocation—excluding any market appreciation, of course.
MSU’s FY2024 Performance Drivers
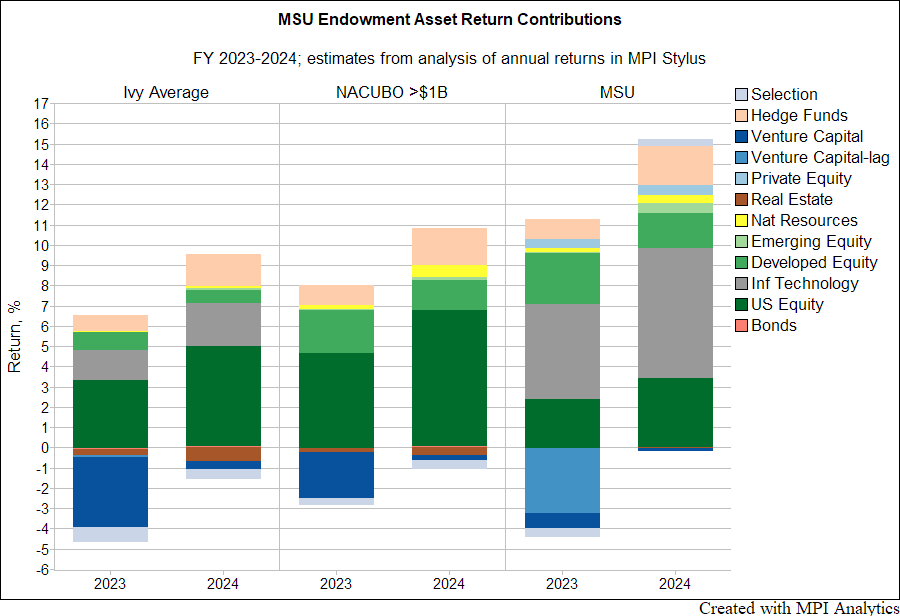 Asset class exposures are key to explaining MSU’s 15.1% FY2024 return. The chart below illustrates the contributions to the endowment’s return over the past two fiscal years:
- MSU’s strong tech stock exposure was the primary driver of returns, supported by hedge funds and equity investments (both domestic and international).
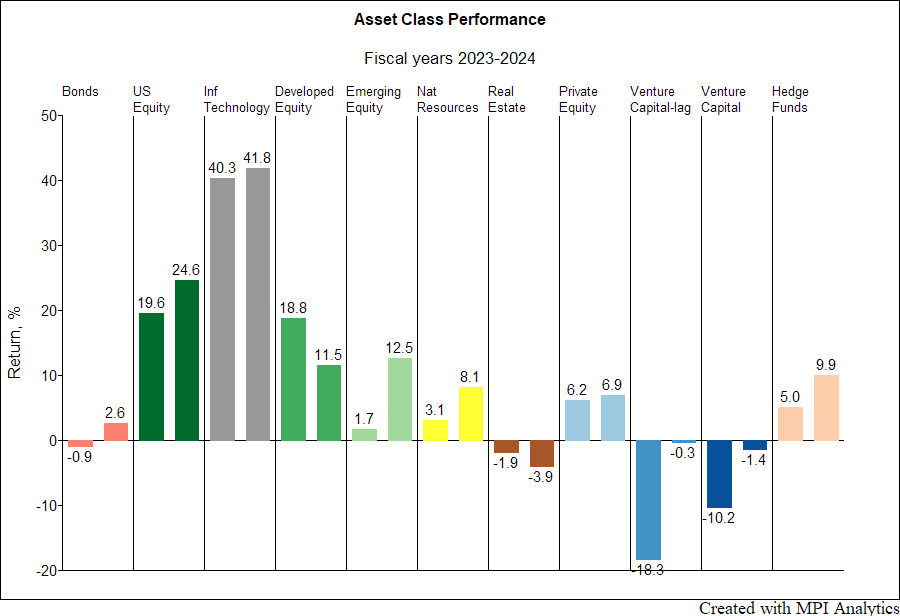
- Tech stocks returned 41.7% in FY2024, nearly double the 24.6% return of U.S. equities making exposure to tech the defining factor in FY2024 performance.
- Unlike Ivy League endowments, MSU did not have major detractors such as real estate dragging down returns.
Risk Analysis Helps to Explain Returns
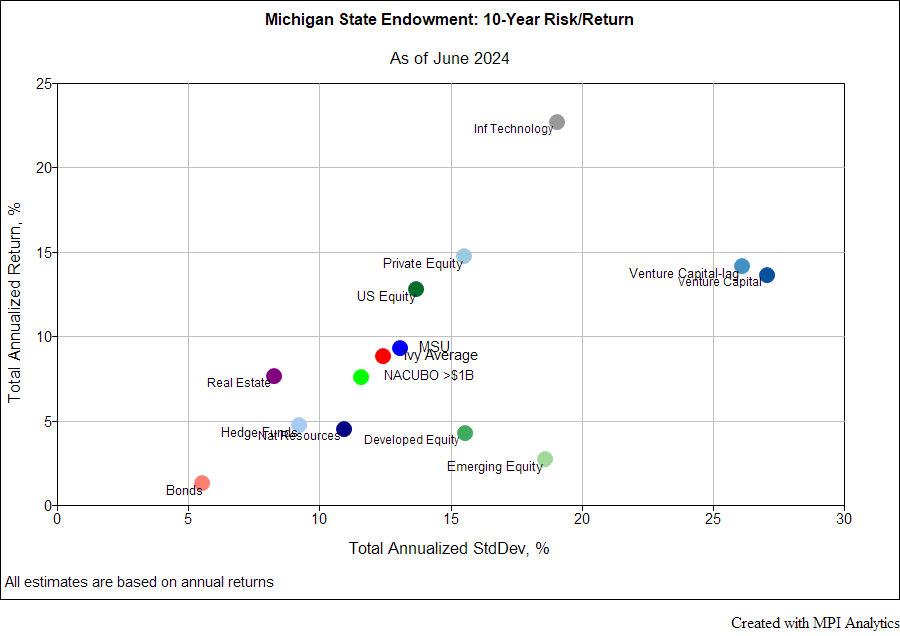 MSU states that its primary goal is to “achieve the desired return while assuming only moderate risk.” However, our Risk/Return analysis of the endowment’s reported annual returns suggests a high-risk strategy:
- The 10-year annualized return and standard deviation (13%) estimates indicate that MSU’s spectacular run is largely a product of its risk appetite.
- The endowment behaves like a leveraged version of the 70/30 benchmark or the Ivy League average, which have standard deviations estimated at 10.6% and 12.4% respectively (also computed using annual returns for consistency).
- Ivy League endowments generally take on significant illiquidity risk following Swensen’s “endowment model.” The MSU endowment—while admittedly less risky than Brown (15.4%) or MIT (17%), still faces similar “liquidity pain” coupled with significant exposure to tech-focused equities and alternatives, having minimal diversifying exposure to fixed income, real estate, or natural resources.[6]
Saves time and money with one comprehensive software platform that provides both historical and forward-looking analysis capabilities
Conclusions
Large university endowments are notoriously opaque—picture an NCAA game played in the dark, with the final score announced to everyone’s surprise. Spectators naturally want to know who scored the most points and how, but even the winning team reveals little. This is where quantitative analysis becomes indispensable, transforming scattered signals—annual returns (like faint sounds and glimpses from the playing field)—into a clear and meaningful picture.
Our quick analysis using MPI Stylus suggests the MSU’s CIF’s success stems from increasing risk exposure and significantly overweighting technology stocks—a strategy that has paid off remarkably well for CIO Philip Zecher. The dominance of the “Magnificent Seven” tech stocks has driven strong market gains, but their high valuations also pose risks. While MSU’s strategy has been highly effective, it remains to be seen how it will fare in the event of a market correction or shifting investor sentiment.
________________________________________
[1] 70% MSCI AC World Index, 30% Bloomberg Aggregate Bond Index, quarterly rebalanced.
[2] We were tempted to add “consistently” to the statement above; however, it’s clear that such an outlier as MSU’s performance in FY2024 could potentially skew all of the trailing numbers for the endowment.
[3] According to CIS financial statements, private investments include private equity, venture capital and distressed debt
[4] As of FY2023, average Ivy endowment allocation to private equity and venture capital was 36.7% according to our study A Private Equity Liquidity Squeeze By Any Other Name
[5] MPI clients typically use daily or monthly returns for mutual funds, institutional SMAs, and hedge funds, and quarterly returns for private equity.
[6] Energy MLPs, for example, a great diversification option providing steady stream of income so needed by endowments. However, the divestment movement forced endowments out of this investment segment entirely.
[i] Disclaimer:
Some statistics on this page are based on exposure estimates obtained through quantitative analysis and, beyond any public information, MPI does not claim to know or insinuate what the actual strategy, positions or holdings of the funds are, nor are we commenting on the quality or merits of the strategies. Deviations between our analysis and the actual holdings and/or management decisions made by funds are expected and inherent in any quantitative analysis. MPI makes no warranties or guarantees as to the accuracy of this statistical analysis, nor does it take any responsibility for investment or any other decisions made by any parties based on this analysis.
Technology Solutions
Trusted by


