The Great Private Equity Squeeze of 2023
We provide some clues as to why some of the largest endowments have disappointing results in FY2023
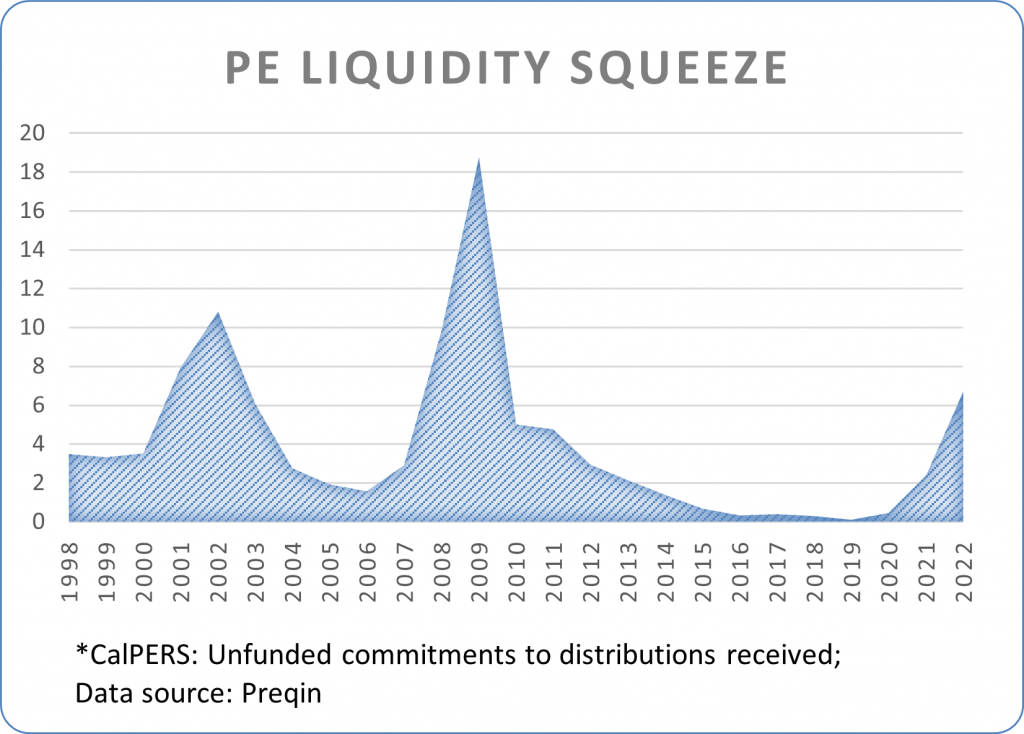
Early data reported by Ivy endowments suggests that both pensions and Ivy endowments are notably underperforming individual FY2023 projection benchmarks in the MPI Transparency Lab. The Lab will provide a detailed attribution of results once all eight Ivies report. In the meantime, the chart below offers a simple clue as to why the “Yale model” is facing challenges this year.
Using CalPERS as an illustration, we show by how much their unfunded PE commitments surpass the cash distributions from PE they received during the year per CalPERS’ own reports. This marks the most significant “squeeze” since the Global Financial Crisis of 2008 (GFC): during the dot-com bubble in 2001-2002 PE distributions covered only 1/10 of the unfunded commitments, compared to 1/18 during the GFC, and now less than 1/6 last year.

To meet capital calls, pensions and endowments must either sell PE investments to secondaries, often at a substantial discount, or sell a portion of their liquid assets, which are often stocks and bonds. This can be particularly challenging if the portfolio is heavily illiquid, as is the case for some Ivy League institutions that have 70-80% of their portfolio in illiquid assets (the average allocation to illiquid private markets at Ivy and elite endowments looks to be about 70%).
Saves time and money with one comprehensive software platform that provides both historical and forward-looking analysis capabilities

Reasons for the high “squeeze ratio” at CalPERS include:
- Very low commitment-weighted average “vintage age” of PE funds. Younger vintage funds tend to have disproportionally high expenses (J-curve) and low distribution levels; and
- Decreasing number of deals and a decline in valuation multiples for the PE industry in general.
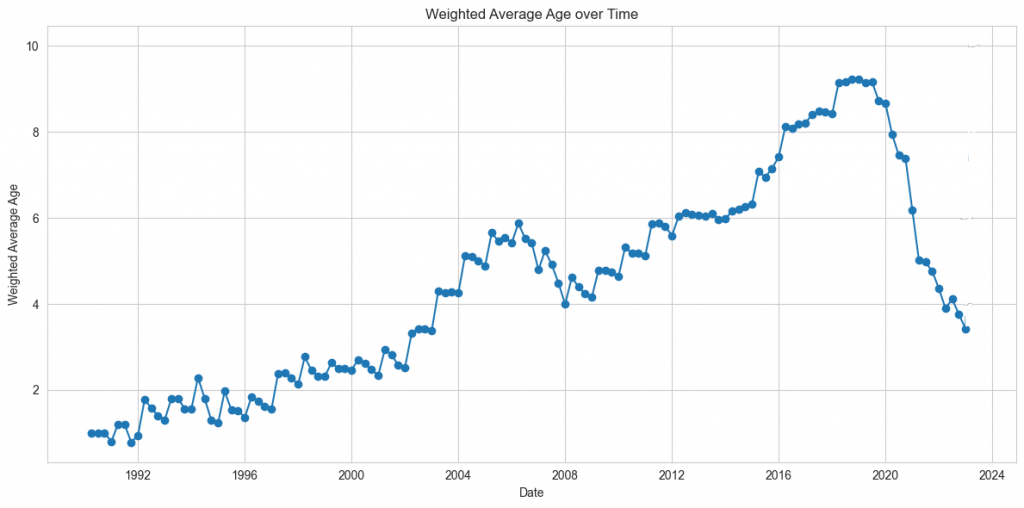
PE vintage age can have dramatic impact on short-term performance. In the chart below, we show commitment-weighted age of private equity funds for CalPERS from the data provided in the Preqin database. After 2008, CalPERS annual commitments to PE were $2.7B on average. During FY2018 the average age of private equity funds was over 9 years. A significant amount of capital was subsequently committed to new funds, peaking in 2021, when CalPERS deployed $13.8 billion. Because these were new funds, the average fund age within their PE portfolio dropped to 3 years.
 This younger vintage age – and therefore the lower level of distributions due to age and deal environment as well as higher fees for younger funds and the potential need to sell legacy assets (whether liquid or illiquid) at some point during a fiscal year featuring a stock market drawdown that bottomed in October, to fund capital commitments – could partially explain why CalPERS FY2023 return was 5.8% – almost 3% lower than the 8.7% benchmark provided by MPI Transparency Lab. Large endowments with substantial allocation to private investments may have experienced similar challenges, which could have led to their underperformance.
Stay tuned for more insights as the MPI Transparency Lab provides a comprehensive report once all data is available.
Offering a practical framework for investment practitioners to screen and monitor liquidity risks in fixed-income products


