

At the request of Barron’s “Focus on Funds” and “ETF Focus” columnist Brendan Conway, MPI performed a quantitative analysis of BFOR, an exchange-traded fund (ETF) based on the Barron’s 400 Index. The index, which seeks to identify “America’s high performing companies” in an effort to beat the market by investing in “growth at a reasonable price”, represents a compelling concept: Can automated stockpicking (based on a well-defined fundamental methodology) consistently outperform the market by identifying a diverse group of “America’s great” companies with upside potential?
It’s a concept with timeless appeal, one that Clarence Barron would probably appreciate, but also one that requires modern computing and deep understanding of current markets and corporate finance. Behind the scenes there is intensive systematic corporate finance data-crunching being done by Barron’s partner, MarketGrader, an investment-research firm that co-developed and has managed the distinctive index since inception in 2007.
The corresponding ETF, BFOR, with its fundamental stock selection, equal weighting, bi-annual rebalancing (Sept and March) and short history (less than 9 months at time of analysis) make it an interesting ETF candidate for performance-based style analysis (as well as one that confounds easy categorization).
Most index funds make for a less than exciting analysis but with Barron’s twist on traditional indexing this is not the case with BFOR.
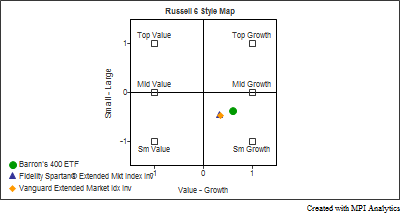
Armed with in-depth knowledge of the index and its recent portfolio rebalancing (only the second since BFOR’s inception), Barron’s hypothesized that we would see an investment style with a strong mid-cap growth bias. Not having much background on the nature of the index and the ETF, we let the objectivity of quantitative modeling take over. Applying a fund analyst’s classic style factor map of the “Russell 6”1 and using the fund’s NAVs, we found the dynamic combination of factor exposures that best explain the performance of BFOR.2
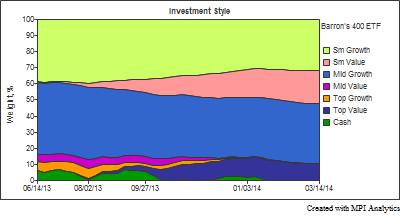
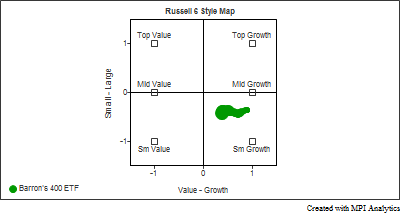
BFOR indeed exhibits a predominantly growth orientation, but with a considerable small-cap bent balancing out the mid-cap weighting. The small-cap exposure is understandable as BFOR is an equal-weighted (EW) portfolio with 400 stocks. EW indexes are more small cap biased compared to cap-weighted indexes. That being said, however, mid-cap and small-cap indexes are highly correlated factors and often such apparent style shifts can be “phantom” shifts that are not really occurring.
Additionally, the ETF’s return behavior indicates exposure to value stocks (small- and mega-cap)3. The value factors’ weightings appear to grow from the first rebalance period in September 2013.
Given the Barron’s 400 Index’s fundamental approach and underlying metrics, this tilt could be from selling growth-oriented names and picking up value stocks or those behaving more in the value camp, as defined by Russell indexes.4 With an index based on pricing and financials, such style drift is understandable. For the investor concerned with the potential for style changes using established indexes like Russell, BFOR is an ETF that requires attention. But for those who are interested in beating the markets, the change in style seems a byproduct of a relentless focus on numbers rather than traditional categorization of valuation.
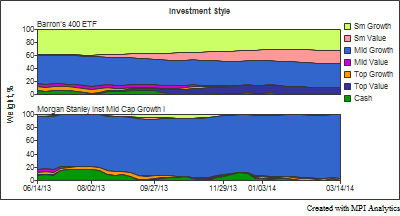
Also at the request of Barron’s, we also analyzed Morgan Stanley Institutional Mid Cap Growth Fund (MPEGX), managed by Morningstar’s 2013 Domestic-Stock Fund Manager of the Year, Dennis Lynch, and the MSIM Growth Team, to compare BFOR with a high performing, actively managed mutual fund. As seen below, a performance-based style analysis revealed that MPEGX is true to its name, exhibiting a steady and wholly mid-cap growth equity style.5
It should be noted that a quantitative comparison between an actively managed portfolio against an enhanced index product, while interesting, is not really an appropriate way to judge either product. Such a comparison should not be the sole determinant of the role or benefits of either product in a portfolio setting.
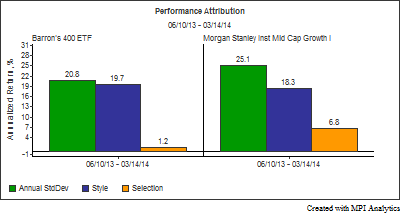
Below we show the risk-adjusted returns of both products in the common period (since inception of BFOR).
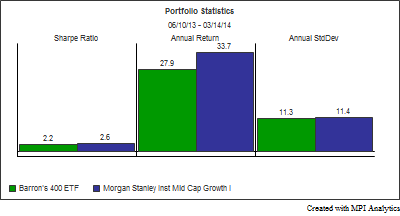
When we look at performance attribution of the two funds, we see some characteristics that are reflective of the differences between active managers and index funds. Returns-based performance attribution is comprised of a “Style Return” (the systematic factor exposures over time) and “Selection Return” (the portion that is not explained by the systematic factors). Selection Return is calculated as the manager’s return less the return of the fund’s dynamic Style Return, and is often attributed to the unique performance of individual securities. As such, Selection Return is often viewed as an indication of the manager’s selection or stockpicking abilities6. Our analysis of MPEGX indicates a Selection Return of 6.4%, compared to 1.2% generated by BFOR.
This relatively small Selection Return on the part of BFOR is not to say it lacks stockpicking ability or alpha. The size of the portfolio is important to note. BFOR maintains a rotating portfolio of 400 stocks, while MPEGX reports between 50 and 70 holdings in its portfolio at any time. Seen through a quantitative lens, highly diversified portfolios typically reduce idiosyncratic behavior and systematic factors are able to explain a majority of a fund’s behavior. This typically results in higher R-square and Style Return attribution values. As such, one should expect a tighter band of returns-based “selection return” (positive or negative). Selection decisions in such an index-based approach, therefore, often appear as Style Return.
For investors looking for funds with similar style to BFOR currently, there are several, including Fidelity Spartan Extended Market Index Investor (FSEMX) and Vanguard Extended Market Index Fund Investor (VEXMX). These behave with similar style, i.e. factor composition, and almost identical risk/return, as BFOR. FSEMX and VEXMX are consistent in their exposure to systematic factors over time, while, as discussed, BFOR has a noted drift since inception when viewed with our chosen factors.
Footnotes
- 1Russell Valuation Style Indexes (Value and Growth) over Russell 2000 (“Small”), Midcap (“Mid”), and Top 200 (“Top”). Top 200 is comprised of XX Cap, and are categorized as Mega Caps by BFOR, for more information, see: http://www.russell.com/indexes/americas/indexes/fact-sheet.page?ic=US5011
- 2DISCLAIMER: MPI conducts performance-based analyses and, beyond public information, does not claim to know or insinuate what the actual strategy, positions or holdings of the funds discussed are, nor are we commenting on the quality or merits of the strategies. This analysis is purely returns-based and does not reflect actual holdings. Deviations between our analysis and the actual holdings and/or management decisions made by funds are expected and inherent in any quantitative analysis. MPI makes no warranties or guarantees as to the accuracy of this statistical analysis, nor does it take any responsibility for investment decisions made by any parties based on this analysis.
- 3Russell Top 200 have an average market cap of $158B and are consensus-classified as mega-cap, above large (represented by Russell 1000 Indexes). There is an advantage to using Top 200 instead of 1000 when Midcap is included in a factor map because of the decrease in collinearity, which results in a more distinct analysis.
- 4 It is important to realize that valuation style indexes, like Russell, Wilshire or S&P, are each based on proprietary methodologies using P/E, P/B, etc. and there is no exact industry consensus on the definition of “growth” and “value”. What Russell, or another provider, may deem value, other providers or analysts may determine to be growth. Thus, perceived deviation in style on the part of an automated stockpicking indexing fund does not necessarily mean that its approach has been altered. Rather, it could come down to differences in style determination based on methodology differences, and applying another set of valuation factors could alter the picture.
- 5For simplicity, we only extended the analysis since inception of BFOR.
- 6Although it could also be attributed to missing systematic factors. For more on skill (i.e. selection and style), in our analysis of the GMO Quality Fund.