
Tools and techniques to identify long term style and short term exposures of a complex investment strategy
Abstract
The largest mutual fund in Europe, Carmignac Patrimoine, has generated impressive relative returns in the recent financial market downturn over 2007-2009 and has over twenty-one years of consistently steady risk-adjusted performance―especially in down markets. This case study provides insight into the manager’s return behavior and risk characteristics by applying return-based style analysis (RBSA) using MPI’s proprietary Dynamic Style Analysis (DSA) technique. Specifically, the analysis reveals how quantitative analysis and sophisticated returns-based analysis techniques can be used to better understand fund behavior, anticipate performance, and improve the overall selection and due diligence process when analyzing investment funds. Click here to download the PDF
Introduction
Carmignac Patrimoine, the largest mutual fund in Europe with AUM of more than 27 billion Euros1, has been on investors’ radar screens for quite some time. Following impressive relative returns in the recent financial market downturn over 2007-2009, coupled with over twenty-one years of consistently steady risk-adjusted performance – especially in down markets, Carmignac Patrimoine has grown from 3 to 27 billion Euros AUM over the last three years. Thanks to its excellent performance history and star manager, Edouard Carmignac, the fund has become a common core holding in many investors’ portfolios. Given its size, performance and popularity, a thorough quantitative analysis of this fund is definitely called of interest to many investors.2
Although the fund is classified into both mixed asset and asset allocation mutual fund categories fund by any means. According to its 2009 annual report, Carmignac Gestion’s fund not only invested in equity and fixed income (government and corporate) assets globally, but also used derivatives extensively, such as options and futures, to manage its risk exposure to currency, credit and equity markets. In this regard, the fund seems much closer to a global macro hedge fund than a traditional, balanced mutual fund. Herein lies the significant challenge for traditional fund analysis methodologies to generate a sufficiently credible analysis of the fund. Given its massive portfolio with thousands of holdings across various asset classes and in different investment regions, good holdings-based analysis could be extremely time-consuming and difficult to implement.
The objective of this case study is to provide insights by applying return-based style analysis (RBSA) using MPI’s proprietary Dynamic Style Analysis (DSA) technique. Based on top-down analysis of macroeconomic fundamentals, the fund invests on medium- and long-term growth potentials in a dynamic and opportunistic fashion. Therefore, understanding the asset allocation in its portfolio is much more important than analyzing individual security holdings, as the former determines the vast majority of its return and risk behavior. We will demonstrate in the sections below how dynamic return-based style analysis can help investors understand the fund’s apparent investment strategy over time as well as identify the fund’s short term performance drivers and style exposures.
Note that MPI does not claim to know or insinuate what the actual strategy, positions or holdings of this fund were; nor are we commenting on the quality or merits of Carmignac Patrimoine’s strategy. Instead, we are trying to demonstrate how quantitative analysis and sophisticated returns-based techniques can be used to better understand fund behavior, anticipate performance, and improve the overall selection and due diligence process when analyzing investment funds.
An Impressive Twenty-Year Track Record
Carmignac Patrimoine (A) – the oldest share class – was launched in December 1989 and has had a superb track record in both performance and risk control. As seen in Figure 1, investing 1000 EUR in September 1990 would result in 6151 EUR in September 2010 (green line), whereas investing the same amount in Carmignac’s stated composite benchmark (50% MSCI AC World index, converted into euro, + 50% Citigroup WGBI All Maturities EUR index rebalanced on January 1 of each year – blue line) would equate to 3510 EUR over the same period. It is also worth noting that the fund’s impressive performance was driven primarily by results in the second decade, i.e. between 2000 and 2010.
Figure 1
Cumulative Performance

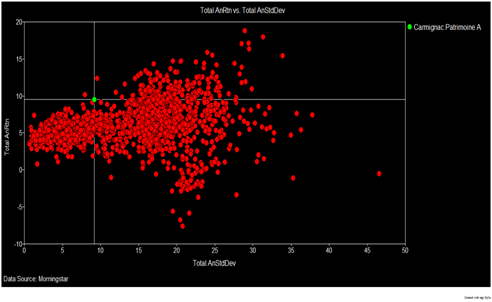
Using Morningstar’s global daily database, which includes all mutual funds registered for sale in the world, we created a universe of 2123 funds that are domiciled in European countries with greater than twenty-years of returns track records. As seen in Figure 2 there are very few European mutual funds in this universe that beat Carmignac Patrimoine (shown in intersection of axis), both in terms of annualized performance and risk over the twenty years timeframe. Between September 1990 and September 2010, Carmignac Patrimoine’s annualized performance was 9.51% with an annualized standard deviation of 9.21%.
Figure 2
20-Year Universe Risk/Return Analysis

Model Selection: Traditional RBSA vs. Dynamic Style Analysis (DSA)
One of the most effective and practical methods of analyzing investment portfolios is called Returns-Based Style Analysis (“RBSA”), a multi-regression methodology first proposed by Nobel Laureate William Sharpe in the late 1980’s to identify a credible portfolio of systematic market factors that explain or best mimic a given mutual fund’s performance variability3. Since its introduction, RBSA and its various forms have been widely used to identify managers’ investment styles, across both traditional and alternative investment funds (Dor et. al. 2003).
However, a major drawback for RBSA in its original form is the basic assumption that the investment style of a fund remains fixed over the whole sample period. The use of rolling window regressions alleviates the drawback to a certain extent but proves to be inadequate in capturing rapid portfolio changes.
In 2003, MPI introduced a proprietary Dynamic Style Analysis (DSA) technique to capture portfolio’s time-varying exposures. DSA implements filtering technique similar to target-tracking technology used by the military to track quickly moving targets, instantaneously detecting changes in direction and acceleration in space. The methodology has since been used effectively in the analysis of a series of high-profile mutual fund and hedge fund case studies4.
With its dynamic asset allocation model and stated broad investment mandate, Carmignac Patrimoine defies the static traditional RBSA model. Therefore, DSA would appear to be preferable to capture the fund’s time-varying exposures.
Factor Selection: Building a Global Macro Factor Map
Besides selecting the right estimation model, factor selection presents another challenge in analyzing a complex and large portfolio such as Carmignac Patrimoine. Given that there is only an approximate 50% correlation between Carmignac Patrimoine’s returns and that of its custom benchmark – comprising only two factors or market indices – it appears that the funds’ performance is driven by multiple other factors.
A comprehensive set of global macro factors should include the market indices that are expected to drive the fund’s performance, but also have a well-defined structure that allows for easy interpretation. Using the fund’s quarterly holding reports for insight, we first identified several broad asset class categories (cash, bonds and equity) and investment regions (developed or emerging), followed by sub asset classes such as Equity Developed Country, Equity Emerging Market, etc. The actual factors within each asset class are further separated into specific countries (U.S., France, etc.). We then associated these factors with real market indices. Additionally, to accommodate the stated derivative positions in the portfolio holdings, we added two commodity indices (S&P GSCI commodity index and S&P GSCI Gold index) as well as CBOE option indices to detect potential hedging exposures. The full set of factors comprises 22 market indices and is shown in the appendix of this study. In the following sections, the style exposures to these indices are aggregated into their associated broader asset class categories (major regions and instruments) for easier interpretation.
It is also important to add that selecting factors for global macro can be challenging since, by definition, global macro managers have the ability to take positions in any market or instrument. Based on academic research (Amenc 2008 and Li Markov and Wermers 2009), of all hedge fund strategies, regression-based analysis of global macro has, in general, one of the lowest explanatory power and R-squared value.
Strategy Review: Long-Term Dynamic Style Analysis
When conducting research on a specific fund, understanding the manager’s investment style might be one of the most important considerations. Although mutual funds, like Carmignac Patrimoine, provide quarterly holdings information, it is tedious and very expensive to piece all of them together to present a long-term picture regarding the manager’s investment strategy. In addition to evaluating the holdings reports, quantitative analysis of the returns should also be done. Using only monthly performance information, MPI’s proprietary dynamic style analysis was run to better understand the fund’s investment style through time. The results presented in Figure 3 represent the fund’s exposures to major assets and strategies; and again do not represent actual holdings. The ability to extract the fund’s static or dynamic exposures, without being confused by myriads of individual holdings, is one the major strengths of Dynamic Style Analysis (DSA).
Figure 3
Long-Term DSA Exposures

Since most of the fund’s over-performance came from the past decade, we decided to look at the last ten years. During this time, the fund’s apparent investment strategy can be best described as highly dynamic, utilizing allocations in equity and fixed income in both developed and emerging markets. Its returns-based investment style has some distinct features:
- Style analysis suggests that the fund is not constrained by minimum investment mandates in overall market position like most traditional mutual funds. On the contrary, it appears to have frequently changed its net market exposures (represented by the non-cash positions) and exposure to individual asset classes. The changes are quite significant through time.
- The fund appears to have made market savvy decisions by correctly anticipating market trends—increasing equity exposure in bull markets and quickly switching to government bonds when market conditions turned negative.
- The manager seems to have a significant portion of his portfolio invested in or exposed to emerging equities which differentiates the fund from its composite benchmark.
- The statistical exposure to gold is constantly increasing whereas the commodity factor exposure only becomes visible between 2004 and 2008.
- It appears that even the fund’s cash position is actively managed. This can be demonstrated through the increased exposure of U.S. 3M T-bill (in USD) at the end of the analysis period.
- The perceived short position in the S&P500 Put/Write index suggests an active shorting/hedging strategy. Even though the fund may not necessarily implement hedging by buying S&P500 put options, the R-squared and Predicted R-Squared5 significantly increase by including this index in the analysis, indicating some hedging may be occurring in this fund.
Figure 4 shows the cumulative performance of the fund (in green) compared to the synthetic returns of the “Style” portfolio (in orange), which reflects the exposure weights shown in Figure 3 over ten years. This Style portfolio is essentially a tracking portfolio created from the dynamic exposures of the market factors identified by the model. The close movement of these two indicates that the fund’s performance can be effectively explained by the dynamic investment style (as shown in Figure 3). Besides, the traditional goodness-of-fit measure, R-squared, is near 90% and the out-of-sample predicted R-squared is 62% (a reasonable level for macro hedge funds) further validates the quality of this analysis. The blue line represents Carmignac Patrimoine’s stated benchmark.
Figure 4
Cumulative Performance of the Fund vs. Its Style Benchmark Replication Portfolio

Fund Monitoring: Short-Term High Frequency Analysis
While understanding a fund’s long-term investment style is critical during the fund selection process, monitoring its short-term trends and projecting short-term performance is crucial once the fund becomes part of an investment portfolio. This is especially important for Carmignac Patrimoine as its portfolio appears to be very actively managed and rapidly changing. The volatility and shifting market conditions of the past 12 months provide an interesting period to analyze the fund’s performance more closely.
Whereas long-term analysis can be done accurately with monthly returns data, properly performing short-term analysis requires higher frequency data, such as weekly or daily returns. As demonstrated in past MPI case studies such as Oppenheimer Core Bond and AXA Rosenberg’s analysis, analyzing managers and portfolios with daily frequency data can uncover hidden risks such as investment strategy deviations, jumps in leverage, tracking error and more that would otherwise go unnoticed with monthly data.
Figure 5
Last 12 Months Fund & Benchmark Returns

As shown in Figure 5, the largest variation in performance from October 2009 through September 2010 was in July 2010 with Carmignac Patrimoine posting negative returns of 3.87%, against its benchmark’s 0.55% drop. Looking more broadly at the fund’s relative performance in up and down markets over the last ten years, Carmignac Patrimoine proved to be an exceptional protector of assets during negative months. Indeed, out of 64 negative months for the composite benchmark between January 2000 and September 2010, Carmignac Patrimoine has beaten its composite benchmark 55 times or 86% of the time. However, July’s relative performance (-3.31%) represents the greatest monthly relative underperformance during a negative month for the composite benchmark over the last ten years.
In their August monthly report, Carmignac director Eric Le Coz admitted an “excess of prudence” in global strategy. He declared that: “The performances of our global management, which were disappointing last month, were the result of an excess of prudence and wariness towards the European circumstances,” and “a few too many gold mines – the quintessential refuge – not enough financials, especially European, not enough Euros and too many dollars – mea culpa.”
Using daily return data, we performed a dynamic style analysis with weekly frequency from July 2009 till June 2010, trying to identify any perceived investment trends before the fund’s underperformance in July.
Figure 6
Short-Term Dynamic Style Analysis

As shown in Figure 6, our dynamic style analysis of the fund displays some obvious trends since the beginning of 2010, behaving as if it was:
- Decreasing its Euro cash exposure while increasing its U.S. dollar exposure
- Decreasing equity exposures while increasing government and corporate bonds
- Steady hedging of U.S. equities and gold exposure
- Slightly increasing exposure to emerging market bonds
The R-squared for this analysis is 90% and Predicted R-squared is over 78% which indicates that the fund’s short term performance can be well-explained with the style profile above.
Cross Validation: Out-of-Sample Performance Tracking
If fund exposures are determined with sufficient accuracy, they could prove helpful for the fund’s daily (and intra-day!) performance monitoring and benchmarking. To illustrate this important function we constructed a hypothetical portfolio using the style exposures based on our in-sample analysis through June, and examine how well this simple buy and hold portfolio tracks the fund’s performance out of sample into July and later. The latest June exposures used for our hypothetical portfolio are shown in Figure 7 and its daily projected returns are compared with the fund’s actual returns in Figure 8.
Figure 7
Projection Portfolio Allocations

As shown in Figure 8, the hypothetical portfolio tracks the daily performance of the fund fairly closely out-of-sample from July to Sept. 2010, only deviating notably from the actual return stream at the end of September. This provides high credibility to both the selected factors and statistical exposures determined through our in-sample analysis. Note that such a result was expected given relatively stable exposure structure and high explanatory power of the in-sample estimation.
The deviation between projected and actual returns in September is of interest. Usually it indicates that either the portfolio exposures have deviated from our buy-hold hypothetical portfolio or there’s a new factor/asset at play. If we view this out-of-sample buy-hold portfolio as a benchmark, the fund’s outperformance of the benchmark in September suggests a positive short-term move on the part of the management team.
Figure 8
Daily Projection vs. Actual Returns

Conclusion
Over the last twenty years, Carmignac Patrimoine’s discretionary trading approach has produced an outstanding performance track record while offering significant market protection to its investors. Carmignac Patrimoine appears to have efficiently employed hedge fund-like investment strategies, while offering the benefits of the mutual fund legal envelope such as daily liquidity.
The quest for portfolio manager talent puts a lot of emphasis on recent and consistent past performance. Unfortunately, in evaluating past performance, style can be routinely confused with skill. In the case of Carmignac Patrimoine, the manager appears to display good long-term asset allocation and market-timing skills, but is not immune to occasional short-term style “misfortunes”.
As described in this case study, a robust and non-intrusive Manager Surveillance framework consists of a series of step-by-step processes: creating a broad performance and risk peer-group analysis framework; choosing the appropriate returns or holdings-based technique; using or building a proper set of style benchmarks or factors; identifying the long term performance drivers of your investment; focusing on high frequency short-term analysis and finally validating your analysis with live out-of-sample tracking portfolios to identify changes in allocations, applicability/fullness of factors and statistical significance of your regression analysis.
At a time when transparency and liquidity are common preoccupations in the investment management world, returns-based style analysis – enhanced by the use of daily NAVs and position information – can enable investors to validate the completeness and accuracy of reported portfolio holdings, monitor rapid style shifts control leverage levels due to use of derivatives and shorting and better anticipate performance behavior. Our analysis shows that some complex investment strategies are often easier to understand than commonly thought. With regards to the highly visible Carmignac Patrimoine fund or to other “nontraditional” mutual funds, proper tools and methodologies – more typically used in the hedge fund space – can be used to uncover dynamic betas, directional market bets and alpha generators.
Appendix
Market indices used as factors in his analysis are:
| Indices | Description |
| Cash | |
| Euro Cash | Eonia Index |
| U.S. Cash | Merrill Lynch 3M T-bill |
| Equity Developed Country | |
| France | MSCI France TR EUR |
| United Kingdom | MSCI United Kingdom TR EUR |
| Germany | MSCI Germany |
| North America | MSCI North America |
| Equity Emerging Market | |
| Asia Emerging | MSCI EM Asia TR USD |
| Latin America | MSCI EM Latin America TR USD |
| Euro Emerging | MSCI EM Euro TR USD |
| Govt Developed Country | |
| U.S. Government | Merrill Lynch U.S. Govt Master |
| U.S. Government | Merrill Lynch U.S. Treasuries, Inflation-Linked |
| French Government | Merrill Lynch French Governments |
| French Government | Merrill Lynch French Governments, Inflation-Linked |
| Euro Government | Merrill Lynch EMU Direct Government Index |
| Euro Government | Merrill Lynch EMU Direct Government, Inflation-Linked |
| Corporate Developed Country | |
| U.S. Corporate | Merrill Lynch U.S. Corporate Master |
| U.S. Corporate | Merrill Lynch U.S. High Yield Master |
| Euro Corporate | Merrill Lynch Euro Corporate Index |
| Euro Corporate | Merrill Lynch Euro High Yield |
| Emerging Sovereign & Corporate | Merrill Lynch Emg Mkt Sovereign & Corporate |
| Commodities | |
| Commodity | S&P GSCI Commodity Index |
| Gold | S&P GSCI Gold Index |
| Options | CBOE Option Indices |
References
Amenc, N., W. Géhin, L. Martellini, J-C Meyfredi. “Passive Hedge Fund Replication: A Critical Assessment of Existing Techniques”, Journal of Alternatives Investments, Volume 11 Issue 2, 2008.
Dor, Jagannathan and Mier, “Understanding Mutual Fund and Hedge Fund Styles Using Return-based Style Analysis”, Journal of Investment Management, Vol. 1, No. 1, (2003), pp. 94-134.
D. Li, M. Markov, R. Wermers. “Monitoring Daily Hedge Fund Performance Using Monthly Data”, Working Paper, 2009.
M. Markov. “The Law of Large Numbers: An Analysis of the Renaissance Fund”, MPI Research, 2007.
M. Markov. “Recent Trends in Hedge Fund Market Exposure”, MPI Research, 2005.
M. Markov, I. Muchnik, O. Krasotkina, V. Mottl. “Dynamic Analysis of Hedge Funds”, The 3rd IASTED International Conference on Financial Engineering and Applications, ACTA Press, Cambridge, October 2006.
W.F. Sharpe. “Asset Allocation: Management Style and Performance Measurement”, The Journal of Portfolio Management, pp. 7-19, Winter 1992.
Footnotes
- 1Source: Carmignac Gestion’s Website. Assets under management on November 31st, 2010 of Carmignac Patrimoine (A): 22 793 963 000 EUR and of Carmignac Patrimoine (E): 4 704 604 000 EUR
- 2Carmignac Patrimoine’s Morningstar category is “EUR Moderate Allocation” whereas Lipper’s Global category is “Mixed Asset EUR Flex – Global”
- 3Returns-based style analysis was first introduced by William F. Sharpe in two articles “Determining a Fund’s Effective Asset Mix,” Investment Management Review, December 1988, pp. 59-69 and “Asset allocation: Management style and performance measurement,” The Journal of Portfolio Management, Winter 1992, pp. 7-19.
- 4Li, Markov and Wermers (2009) test the effectiveness of both rolling-window RBSA and DSA with in-sample and out-of-sample analysis on major hedge fund indices.
- 5Predicted R-Squared is MPI’s proprietary explanatory power measure and cross validation statistic.