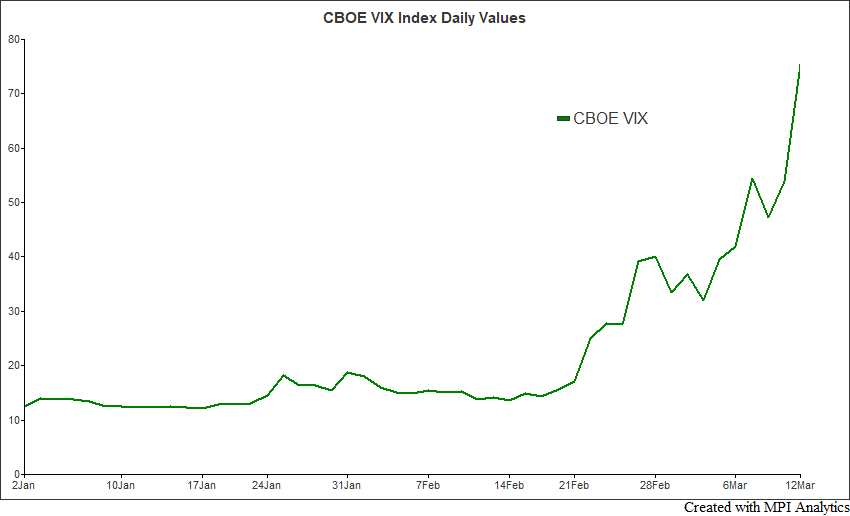
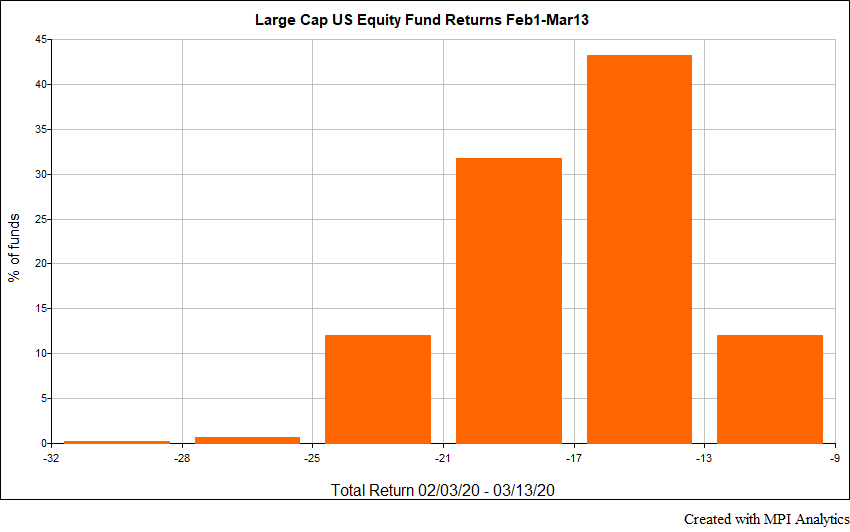
The past few weeks have been very challenging for all of us. As we navigate the news cycles and aim to keep our information intake at a healthy level, it is important to stay focused and calm during turbulent times. Likewise, when investors are faced with increasingly high stock market volatility, it is often prudent to de-risk. However, for most mutual fund managers a significant sell-off or hedging of core assets is not acceptable as such practices are typically outside funds’ prescribed mandates. As market volatility shot up in February and March (as measured by VIX in the chart above), most active Large-Cap U.S. mutual funds appear to have remained nearly fully invested and witnessed their portfolios losing between -10% and -30% over the past month and a half (vs. -15.7% for S&P 500 Index).1
However, some funds, such as Akre Focus Instl (AKRIX), were known to hold significant amounts of cash as of December 2019 (18% per Morningstar2), so the fact that this fund lost less than the other 446 non-index U.S. Large Cap mutual funds (with AUM>$500M) is not surprising. Whether this or other funds in the group increased their cash exposure or hedged during February or March, we won’t know for months due to the reporting lag. And it is likely investors may never know. Funds are required to report positions at the end of each quarter, though some report monthly, so any short-term dynamic changes in allocations during this period won’t be reflected.
The good news for investors is that mutual funds publish daily NAVs which can be used to get daily transparency on the fund manager’s “macro” moves such as sectors, styles, cash allocations, etc. Below, we use our Stylus Pro system’s patented Dynamic Style Analysis (DSA) with daily fund data to determine whether active Large-Cap mutual funds have substantially decreased market exposure in the highly volatile period from early-February to mid-March.3 DSA with daily data has proved crucial in detecting short-term allocation changes of funds.
For the universe of 447 active Large-Cap U.S. Equity mutual funds, the scatter chart below shows the percentage of each fund’s estimated increase in cash exposure (Y-axis) vs. each fund’s total $AUM (X-axis). Each point on the chart corresponds to a fund in the universe. If the fund appears above the X-axis, its cash exposure has increased by the Y-coordinate amount since the beginning of the year. Likewise, for points below the axis, their cash exposure has decreased by the Y-axis amount. Funds with significant changes (over 5%) are highlighted in orange.4
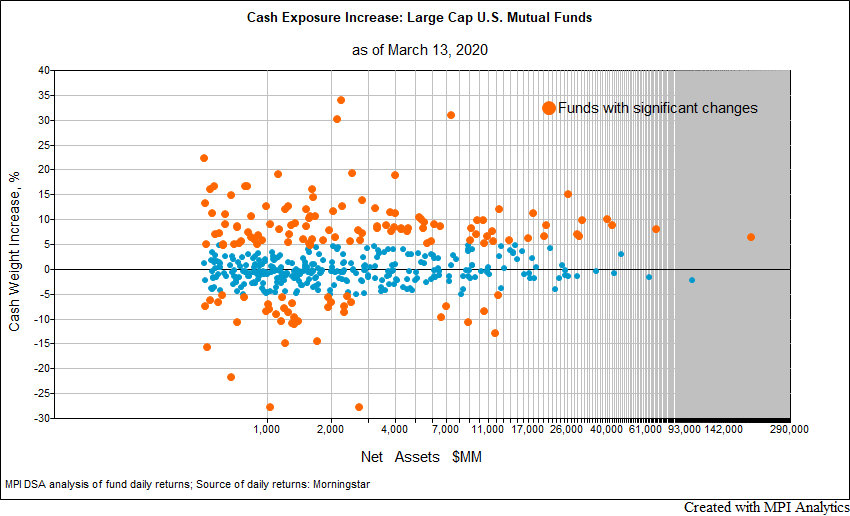
Not surprisingly, we estimate that most of the funds increased cash exposure in the period, some of them substantially so. But there are several funds that significantly lowered their cash exposure. One example is the anonymous Equity Income fund with $2.5B shown in the chart below (cash exposure is shown in green). The fund’s disclosures show a 29% cash position as of 2019 year-end, so our cash estimate in the chart is fairly accurate. As of March 13th, the fund was fully invested by our estimates.
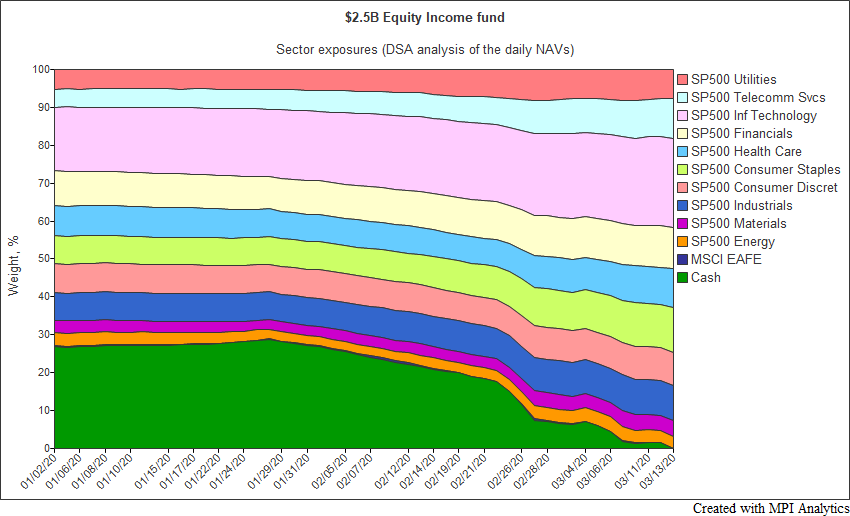
It’s worth noting that per the fund’s last portfolio disclosure, it had sold S&P 500 index call options with different expiration dates, so we may be witnessing an artifact of derivatives accounting rather than an actual reinvestment in the market.
The $21B AUM Growth equity fund in the chart below is an example drawn from the majority of funds that increased their cash exposure at the end of February – beginning of March. Also, note the increased exposure to defensive sectors – Utilities, Healthcare and Consumer staples – which seems like a sensible thing to do in this highly volatile market.

It goes without saying that in volatile times like the present, it is prudent to have as much transparency with regard to fund risk exposures in your portfolio as possible. Rather than waiting a few months to discover shifts in your funds’ portfolios that are too late for you to respond to effectively, more frequent exposure estimates can help investors, consultants and advisors make more informed allocation and risk management decisions that may be necessary during periods of elevated volatility.
Footnotes
- 1Source of fund data: Morningstar. 447 mutual funds include all non-index funds in Large Cap Growth, Blend and Value categories with AUM greater than $500M.
- 2Here and further fund holdings information is taken from either Morningstar or funds’ websites.
- 3DISCLAIMER: MPI conducts performance-based analyses and, beyond any public information, does not claim to know or insinuate what the actual strategy, positions or holdings of the funds discussed are, nor are we commenting on the quality or merits of the strategies. This analysis is purely returns-based and does not reflect actual holdings. Deviations between our analysis and the actual holdings and/or management decisions made by funds are expected and inherent in any quantitative analysis. MPI makes no warranties or guarantees as to the accuracy of this statistical analysis, nor does it take any responsibility for investment decisions made by any parties based on this analysis.
- 4Please note that cash exposure is estimated and in certain cases may not be directly tied to the actual cash or bond position increase, but rather a reflection of defensiveness of stocks or use of derivatives.