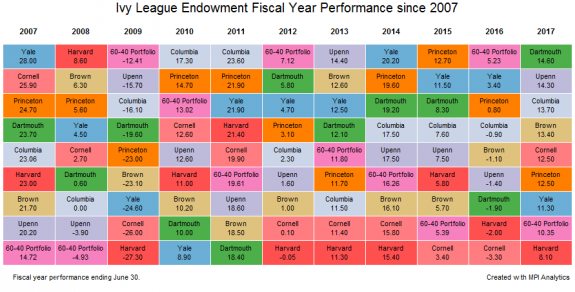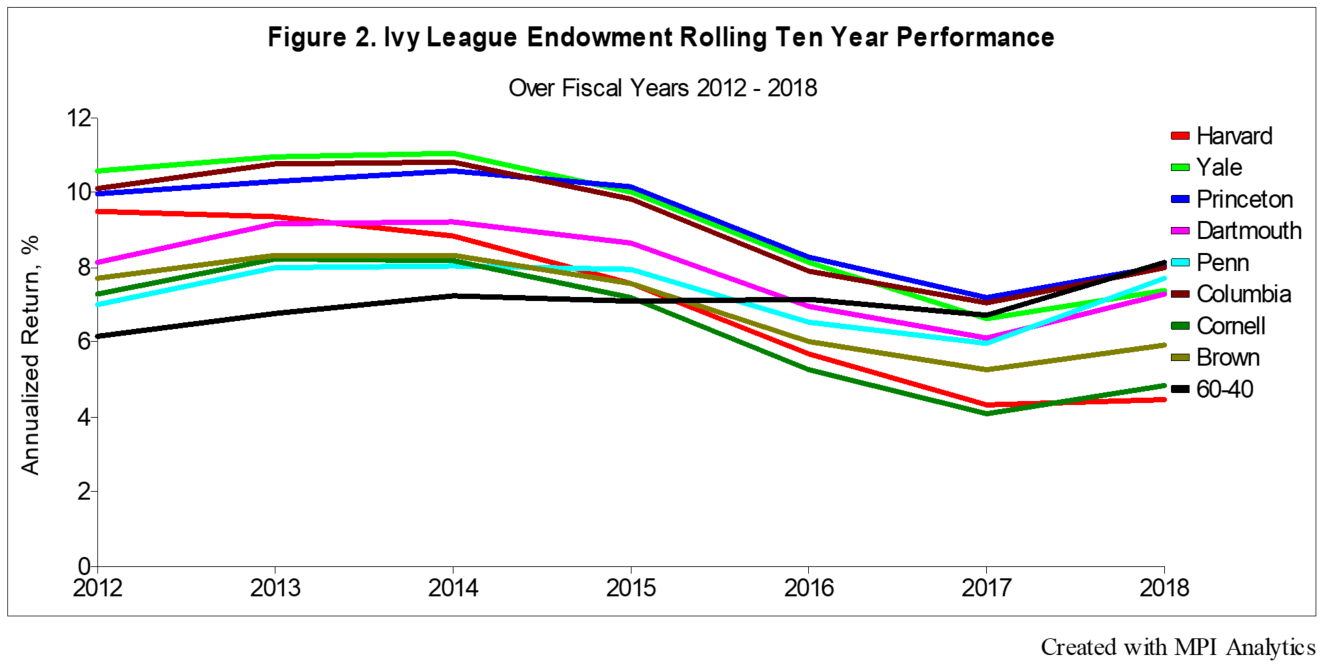
Similar to 2017 performance, this past fiscal year was a strong one for most Ivy League endowments. Fiscal year 2018 is noteworthy, however, for being the first year that long horizon (10-year) returns from all Ivy endowments lagged behind the 60-40 portfolio.
Ivy League Endowments
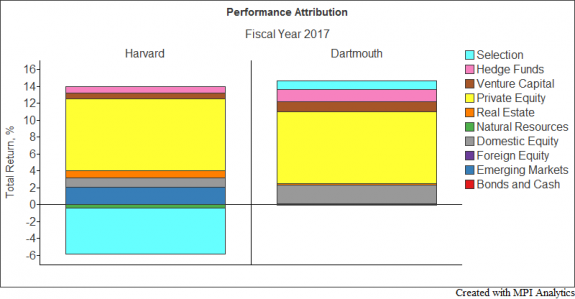
Returns across the Ivy League are largely seen as being driven by exposure to private equity and venture capital.
At the midway point of fiscal year reporting for the Ivy League endowments, our research team analyzes what we know so far to identify the key drivers of returns.
In stark contrast to FY 2016, this past year was a strong one for most endowments. In fact, nearly all the Ivy League endowments, Harvard being the only exception, beat the 60-40 portfolio, a commonly cited benchmark that endowments measure their performance against.
The returns of endowments can be attributed to two fundamental components: asset allocation and security selection. Asset allocation is what a factor model is generally able to explain, shown in terms of factor exposures.
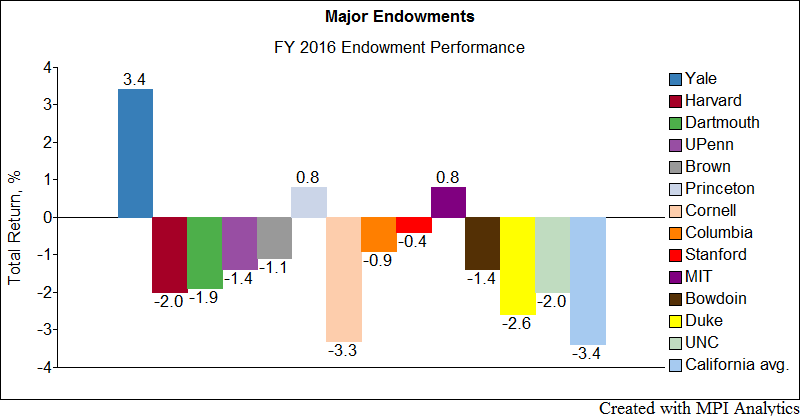
We look at the largest endowments and find striking similarities in their asset class exposures. At the same time, some endowments stand out both in terms of allocations and FY2016 performance.